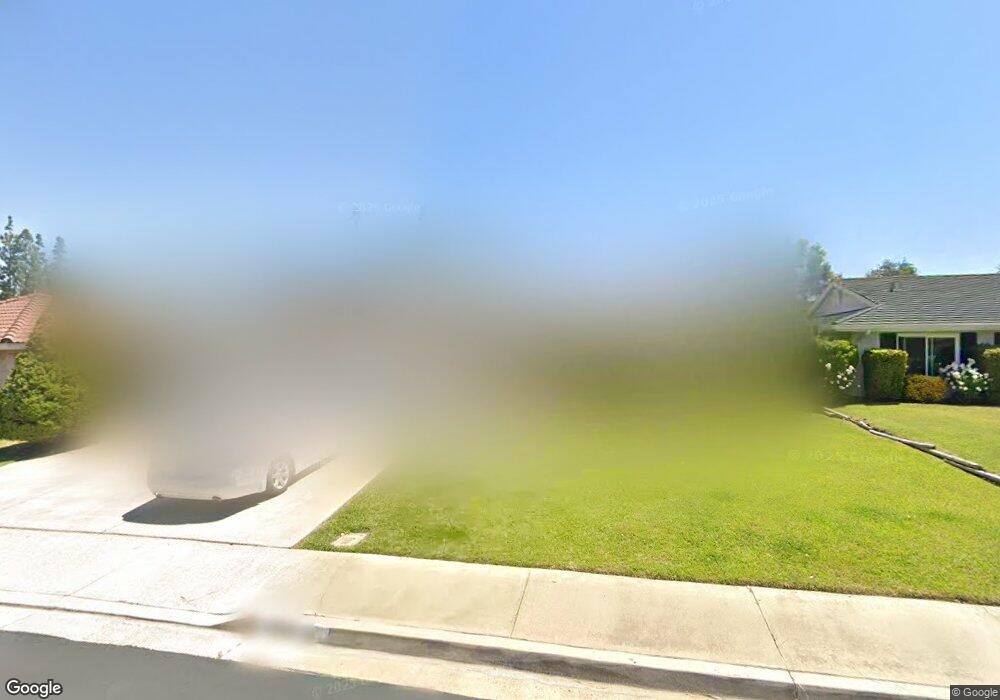
21862 Ute Way Lake Forest, CA 92630
Estimated Value: $1,047,000 - $1,293,000
3
Beds
3
Baths
1,684
Sq Ft
$687/Sq Ft
Est. Value
About This Home
This home is located at 21862 Ute Way, Lake Forest, CA 92630 and is currently estimated at $1,157,185, approximately $687 per square foot. 21862 Ute Way is a home located in Orange County with nearby schools including La Madera Elementary School, Serrano Intermediate School, and El Toro High School.
Ownership History
Date
Name
Owned For
Owner Type
Purchase Details
Closed on
Sep 18, 2002
Sold by
Lung Yvonne Lizette
Bought by
Lung Christopher R
Current Estimated Value
Home Financials for this Owner
Home Financials are based on the most recent Mortgage that was taken out on this home.
Original Mortgage
$301,600
Outstanding Balance
$123,688
Interest Rate
5.99%
Estimated Equity
$1,033,497
Purchase Details
Closed on
Dec 14, 1998
Sold by
Patricia A Lung Christopher R
Bought by
Lung Christopher R
Home Financials for this Owner
Home Financials are based on the most recent Mortgage that was taken out on this home.
Original Mortgage
$162,000
Interest Rate
6.91%
Purchase Details
Closed on
Sep 8, 1994
Sold by
Lung Margaret Peggy R
Bought by
Lung Christopher R
Purchase Details
Closed on
Aug 30, 1994
Sold by
Lung Christopher R
Bought by
Lung Christopher R and Lung Robert J
Create a Home Valuation Report for This Property
The Home Valuation Report is an in-depth analysis detailing your home's value as well as a comparison with similar homes in the area
Home Values in the Area
Average Home Value in this Area
Purchase History
| Date | Buyer | Sale Price | Title Company |
|---|---|---|---|
| Lung Christopher R | -- | Stewart Title | |
| Lung Christopher R | -- | Gateway Title Company | |
| Lung Christopher R | -- | -- | |
| Lung Christopher R | -- | -- |
Source: Public Records
Mortgage History
| Date | Status | Borrower | Loan Amount |
|---|---|---|---|
| Open | Lung Christopher R | $301,600 | |
| Closed | Lung Christopher R | $162,000 |
Source: Public Records
Tax History
| Year | Tax Paid | Tax Assessment Tax Assessment Total Assessment is a certain percentage of the fair market value that is determined by local assessors to be the total taxable value of land and additions on the property. | Land | Improvement |
|---|---|---|---|---|
| 2025 | $3,649 | $361,754 | $195,498 | $166,256 |
| 2024 | $3,649 | $354,661 | $191,664 | $162,997 |
| 2023 | $3,562 | $347,707 | $187,906 | $159,801 |
| 2022 | $3,497 | $340,890 | $184,222 | $156,668 |
| 2021 | $3,426 | $334,206 | $180,609 | $153,597 |
| 2020 | $3,395 | $330,780 | $178,757 | $152,023 |
| 2019 | $3,326 | $324,295 | $175,252 | $149,043 |
| 2018 | $3,262 | $317,937 | $171,816 | $146,121 |
| 2017 | $3,196 | $311,703 | $168,447 | $143,256 |
| 2016 | $3,142 | $305,592 | $165,144 | $140,448 |
| 2015 | $3,102 | $301,002 | $162,663 | $138,339 |
| 2014 | $3,034 | $295,106 | $159,476 | $135,630 |
Source: Public Records
Map
Nearby Homes
- 25396 Shawnee Dr
- 25652 Rimgate Dr Unit 6H
- 25582 Hazelnut Ln
- 25152 Mammoth Cir
- 25671 Le Parc Unit 59
- 25761 Le Parc Unit 82
- 25631 Mont Pointe Unit 7D
- 25712 Le Parc Unit 41
- 21931 Rimhurst Dr Unit K
- 21921 Rimhurst Dr Unit 130-G
- 25614 Mont Pointe Unit 3D
- 21991 143 Rimhurst
- 21466 Cypresswood
- 25701 View Pointe Unit 8C
- 25011 Mammoth Cir
- 25728 View Pointe Unit 4G
- 25224 Birch Grove Ln Unit 3
- 21511 Kinsale Dr
- 24931 Timberwood Way
- 21646 Fernleaf Dr
- 21872 Ute Way
- 21852 Ute Way
- 21882 Ute Way
- 21861 Ute Way
- 21881 Ute Way
- 21851 Ute Way
- 21832 Ute Way
- 21892 Ute Way
- 21901 Ute Way
- 25436 Morningstar Rd
- 25442 Morningstar Rd
- 21852 Sioux Dr
- 25434 Morningstar Rd
- 25444 Morningstar Rd
- 21896 Ute Way
- 25432 Morningstar Rd
- 25411 Teton Way
- 25446 Morningstar Rd
- 21902 Ute Way
- 25426 Morningstar Rd
Your Personal Tour Guide
Ask me questions while you tour the home.