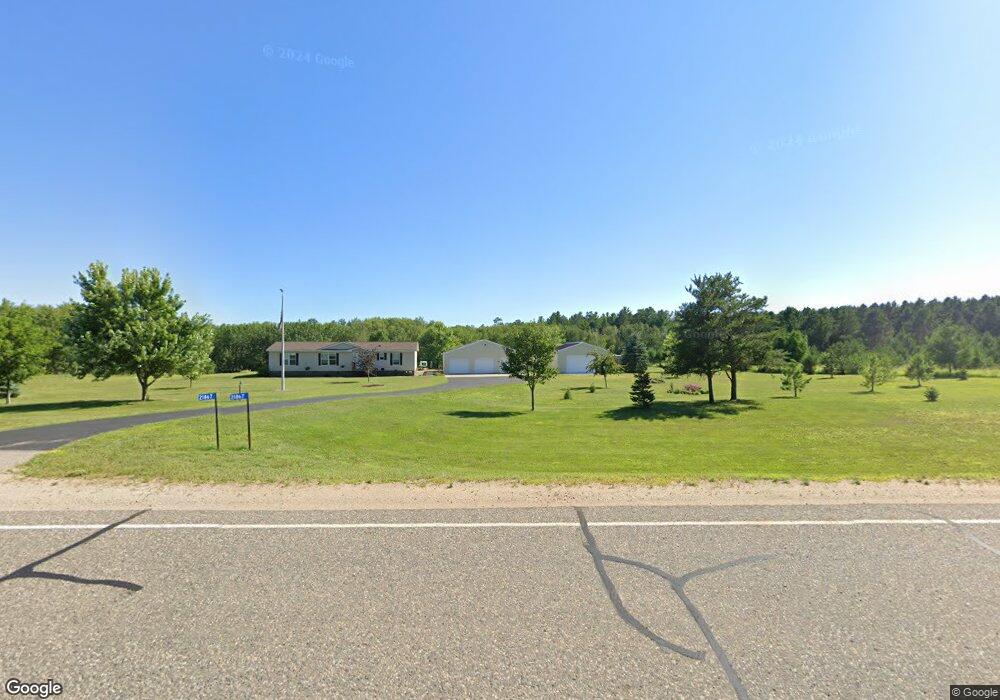
21867 County 17 Park Rapids, MN 56470
Estimated Value: $246,352 - $307,000
3
Beds
2
Baths
1,620
Sq Ft
$173/Sq Ft
Est. Value
About This Home
This home is located at 21867 County 17, Park Rapids, MN 56470 and is currently estimated at $279,838, approximately $172 per square foot. 21867 County 17 is a home located in Hubbard County with nearby schools including Nevis Elementary School, Nevis Area Learning Program, and Nevis Secondary School.
Ownership History
Date
Name
Owned For
Owner Type
Purchase Details
Closed on
Jul 25, 2022
Sold by
Adickes and Gwendolyn
Bought by
Kruger Therese
Current Estimated Value
Home Financials for this Owner
Home Financials are based on the most recent Mortgage that was taken out on this home.
Original Mortgage
$190,000
Interest Rate
5.23%
Mortgage Type
Construction
Purchase Details
Closed on
Jun 6, 2022
Sold by
Dose Joleen H and Dose Allan
Bought by
Adickes Clyde W and Adickes Gwendolyn M
Home Financials for this Owner
Home Financials are based on the most recent Mortgage that was taken out on this home.
Original Mortgage
$190,000
Interest Rate
5.23%
Mortgage Type
Construction
Purchase Details
Closed on
Jan 12, 2012
Sold by
Adickes Clyde W and Adickes Gwendolyn M
Bought by
Dose Joleen H and Adickes Aaron C
Purchase Details
Closed on
Dec 21, 2011
Sold by
Adickes Clyde W and Adickes Gwendolyn M
Bought by
Dose Joleen H and Adickes Aaron C
Create a Home Valuation Report for This Property
The Home Valuation Report is an in-depth analysis detailing your home's value as well as a comparison with similar homes in the area
Purchase History
| Date | Buyer | Sale Price | Title Company |
|---|---|---|---|
| Kruger Therese | $230,000 | Leer Title | |
| Adickes Clyde W | $500 | Thomason Swanson & Zahn Pllc | |
| Dose Joleen H | -- | None Available | |
| Dose Joleen H | -- | None Available |
Source: Public Records
Mortgage History
| Date | Status | Borrower | Loan Amount |
|---|---|---|---|
| Closed | Kruger Therese | $190,000 |
Source: Public Records
Tax History
| Year | Tax Paid | Tax Assessment Tax Assessment Total Assessment is a certain percentage of the fair market value that is determined by local assessors to be the total taxable value of land and additions on the property. | Land | Improvement |
|---|---|---|---|---|
| 2024 | $1,154 | $182,400 | $51,700 | $130,700 |
| 2023 | $1,304 | $211,900 | $43,900 | $168,000 |
| 2022 | $880 | $179,500 | $39,000 | $140,500 |
| 2021 | $870 | $117,800 | $31,300 | $86,500 |
| 2020 | $1,016 | $87,300 | $23,143 | $64,157 |
| 2019 | $1,002 | $105,400 | $25,364 | $80,036 |
| 2018 | $906 | $83,200 | $18,899 | $64,301 |
| 2016 | $764 | $79,000 | $18,601 | $60,399 |
| 2015 | $660 | $81,800 | $17,978 | $63,822 |
| 2014 | $580 | $77,900 | $18,000 | $59,900 |
Source: Public Records
Map
Nearby Homes
- 14788 Coyote Dr
- 14449 209th Ave
- 21606 Elmwood Cir
- 16735 Downey Dr
- 20151 Eddie Baxter Dr
- Tbd Evergreen
- 18040 150th St
- 18684 County 20
- 18575 State 34
- 23847 Arcade Loop
- 15769 169th Ave
- 13149 Breezy Pines Dr
- 22015 Aquatic Dr
- 14233 County 6
- 17333 169th Ave
- 24569 County 18
- 16361 State 87
- 18303 County 4
- xxx Elk Haven Dr
- 393 West Ave
- 15648 Cranberry Dr
- 15649 Cranberry Dr
- 15648 15648 Cranberry-Drive-
- 15648 Cranberry Dr
- 21809 21809 Crane Ln
- 21831 Crane Ln
- TBD Cranberry Dr
- 15583 Cranberry Dr
- TBD County 17
- 15571 Cranberry Dr
- 21809 Crane Ln
- 21856 County 17
- TBD County 17
- 21805 Crane Ln
- 15554 Cranberry Dr
- 22110 County 17
- 15477 Cranberry Dr
- 15475 Cranberry Dr
- 21623 Crane Ln
- 15475 Cranberry Dr
Your Personal Tour Guide
Ask me questions while you tour the home.