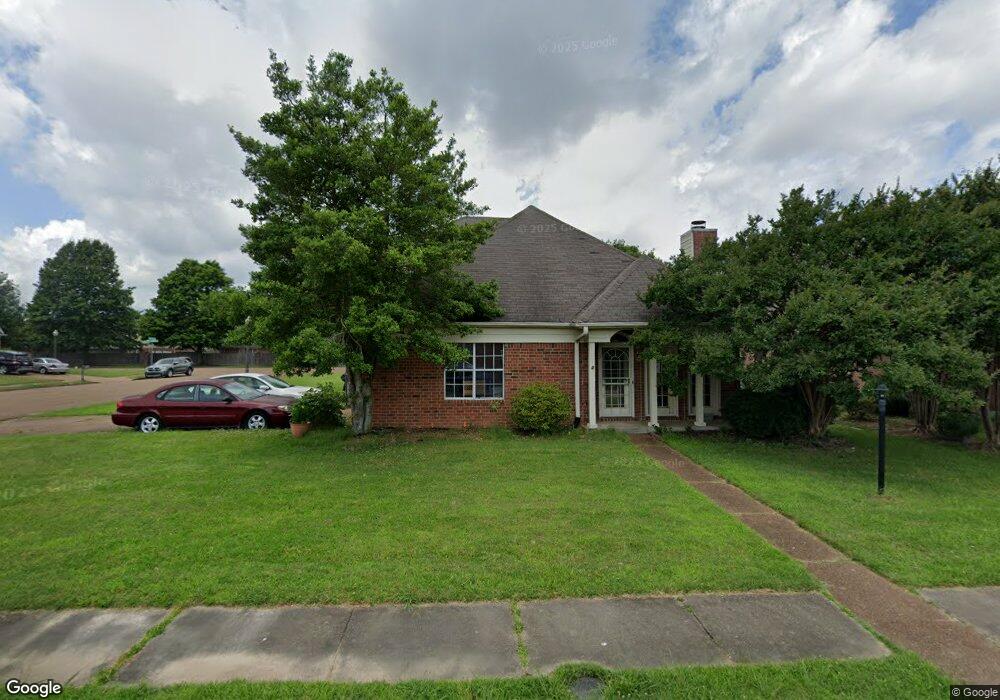
2187 Lake Springs Ln Cordova, TN 38016
Cordova NeighborhoodEstimated Value: $240,000 - $264,211
3
Beds
3
Baths
1,864
Sq Ft
$133/Sq Ft
Est. Value
About This Home
This home is located at 2187 Lake Springs Ln, Cordova, TN 38016 and is currently estimated at $248,553, approximately $133 per square foot. 2187 Lake Springs Ln is a home located in Shelby County with nearby schools including Chimneyrock Elementary School, Cordova High School, and Kate Bond Middle School.
Ownership History
Date
Name
Owned For
Owner Type
Purchase Details
Closed on
Sep 8, 2017
Sold by
Ct Amm B2 Llc
Bought by
P Fin I Llc
Current Estimated Value
Purchase Details
Closed on
Dec 10, 2015
Sold by
Caf B L 2015 Llc
Bought by
Ct Amm B2 Llc
Purchase Details
Closed on
Sep 19, 2014
Sold by
Saeed Ghazal
Bought by
Prager Bridge Property I Llc
Purchase Details
Closed on
Apr 27, 2011
Sold by
Saeed Salman
Bought by
Saeed Ghazal
Purchase Details
Closed on
Feb 19, 2010
Sold by
Barrow Monte J and Barrow Katheryn E
Bought by
The Secretary Of Housing & Urban Develop
Purchase Details
Closed on
Jul 28, 2000
Sold by
Morrow Kevin C and Morrow Rs Rs E
Bought by
Barrow Katheryn E
Home Financials for this Owner
Home Financials are based on the most recent Mortgage that was taken out on this home.
Original Mortgage
$126,935
Interest Rate
8.23%
Mortgage Type
FHA
Create a Home Valuation Report for This Property
The Home Valuation Report is an in-depth analysis detailing your home's value as well as a comparison with similar homes in the area
Home Values in the Area
Average Home Value in this Area
Purchase History
| Date | Buyer | Sale Price | Title Company |
|---|---|---|---|
| P Fin I Llc | -- | None Available | |
| Ct Amm B2 Llc | -- | None Available | |
| Prager Bridge Property I Llc | $133,939 | None Available | |
| Saeed Ghazal | -- | Stewart Title Of Memphis Inc | |
| The Secretary Of Housing & Urban Develop | $129,012 | None Available | |
| Barrow Katheryn E | $127,000 | First American Title |
Source: Public Records
Mortgage History
| Date | Status | Borrower | Loan Amount |
|---|---|---|---|
| Previous Owner | Barrow Katheryn E | $126,935 |
Source: Public Records
Tax History Compared to Growth
Tax History
| Year | Tax Paid | Tax Assessment Tax Assessment Total Assessment is a certain percentage of the fair market value that is determined by local assessors to be the total taxable value of land and additions on the property. | Land | Improvement |
|---|---|---|---|---|
| 2025 | $1,405 | $64,550 | $12,000 | $52,550 |
| 2024 | $1,405 | $41,450 | $6,875 | $34,575 |
| 2023 | $2,525 | $41,450 | $6,875 | $34,575 |
| 2022 | $2,525 | $41,450 | $6,875 | $34,575 |
| 2021 | $3,001 | $41,450 | $6,875 | $34,575 |
| 2020 | $2,234 | $30,825 | $6,875 | $23,950 |
| 2019 | $985 | $30,825 | $6,875 | $23,950 |
| 2018 | $985 | $30,825 | $6,875 | $23,950 |
| 2017 | $1,008 | $30,825 | $6,875 | $23,950 |
| 2016 | $1,223 | $27,975 | $0 | $0 |
| 2014 | $1,223 | $27,975 | $0 | $0 |
Source: Public Records
Map
Nearby Homes
- 2242 Hickory Path Dr
- 2144 Brackenbury Ln
- 8716 Grandbury Place
- 2268 Lake Springs Ln
- 8851 Dexter Rd
- 8744 Grandbury Place
- 2211 Lake Hill Ct
- 8915 Johnston St
- 2379 Meadow Ridge Dr
- 1986 Wirily Ln
- 1979 Hamburg Cove
- 8786 Cherry Spring Dr
- 1965 Capas Cove
- 0 Berryhill Rd Unit 10185975
- 8944 Meadow Pines Cove
- 8699 Cherry Spring Dr
- 2247 Applemill Dr
- 2389 Carroll Ridge Ln
- 2190 Berry Bush Ln
- 2185 Littlemore Dr
- 2191 Lake Springs Ln
- 2195 Lake Springs Ln
- 2132 Valley Edge Dr
- 2199 Lake Springs Ln
- 2126 Valley Edge Dr
- 2138 Valley Edge Dr
- 2142 Valley Edge Dr
- 2194 Lake Springs Ln
- 2203 Lake Springs Ln
- 2198 Lake Springs Ln
- 2190 Lake Springs Ln
- 2202 Lake Springs Ln
- 8902 Hidden Springs Cove
- 2207 Angel Crest Cir
- 2148 Valley Edge Dr
- 2178 Lakefield Cove
- 2207 Lake Springs Ln
- 2206 Lake Springs Ln
- 2182 Lakefield Cove
- 2152 Valley Edge Dr