2187 Main St West Barnstable, MA 02668
West Barnstable NeighborhoodEstimated Value: $941,000 - $1,388,000
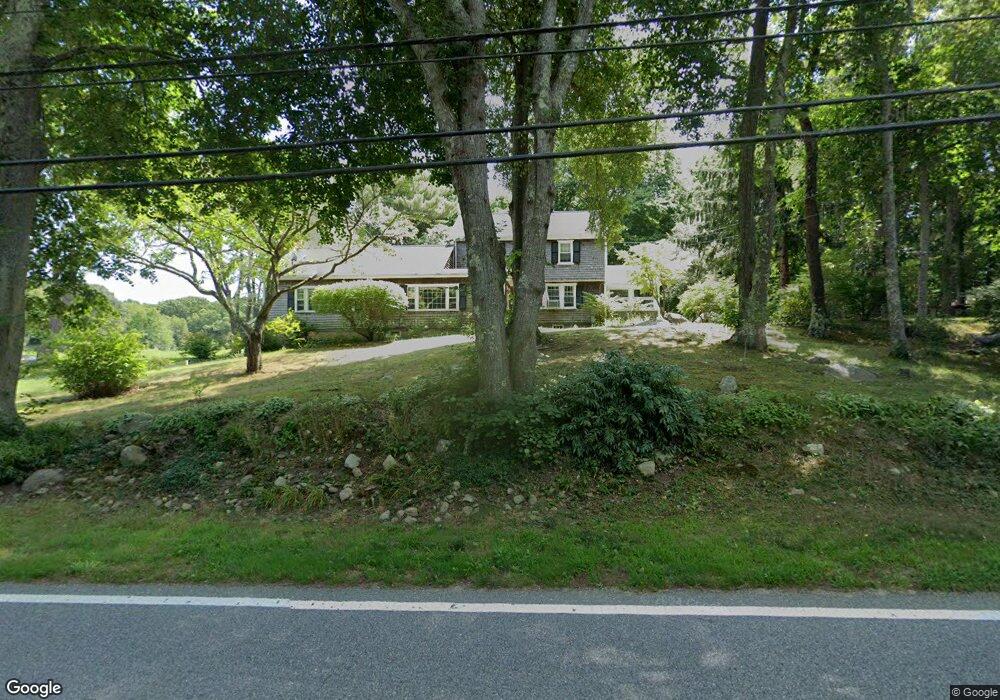
About This Home
This home is located at 2187 Main St, West Barnstable, MA 02668 and is currently estimated at $1,078,083, approximately $347 per square foot. 2187 Main St is a home located in Barnstable County with nearby schools including West Barnstable Elementary School, Barnstable United Elementary School, and Barnstable Intermediate School.
Ownership History
We collect this data history from publicly available records. To have your information removed, we recommend requesting removal directly through your county’s website.
Purchase Details
Home Values in the Area
Average Home Value in this Area
Purchase History
We collect this data history from publicly available records. To have your information removed, we recommend requesting removal directly through your county’s website.
| Date | Buyer | Sale Price | Title Company |
|---|---|---|---|
| $222,000 | -- |
Mortgage History
We collect this data history from publicly available records. To have your information removed, we recommend requesting removal directly through your county’s website.
| Date | Status | Borrower | Loan Amount |
|---|---|---|---|
| Closed | $544,185 | ||
| Closed | $50,000 | ||
| Closed | $35,000 | ||
| Closed | $60,250 |
Tax History
We collect this data history from publicly available records. To have your information removed, we recommend requesting removal directly through your county’s website.
| Year | Tax Paid | Tax Assessment Tax Assessment Total Assessment is a certain percentage of the fair market value that is determined by local assessors to be the total taxable value of land and additions on the property. | Land | Improvement |
|---|---|---|---|---|
| 2025 | $7,772 | $841,100 | $218,700 | $622,400 |
| 2024 | $7,018 | $801,100 | $218,700 | $582,400 |
| 2023 | $6,467 | $720,200 | $217,700 | $502,500 |
| 2022 | $6,505 | $582,900 | $159,100 | $423,800 |
| 2021 | $6,318 | $539,500 | $159,100 | $380,400 |
| 2020 | $5,859 | $477,900 | $159,600 | $318,300 |
| 2019 | $5,841 | $478,000 | $159,600 | $318,400 |
| 2018 | $5,755 | $457,500 | $175,000 | $282,500 |
| 2017 | $5,601 | $448,100 | $175,000 | $273,100 |
| 2016 | $5,524 | $448,000 | $174,900 | $273,100 |
| 2015 | $5,977 | $493,600 | $167,400 | $326,200 |
Map
- 34 Black Duck Ln
- 1945 Main St
- 24 Acorn Dr
- 11 Shepherds Way
- 350 Plum St
- 350/360 Plum St
- 2849 Main St
- 578 Huckins Neck Rd
- 10 Marthas Way
- 79 Sturgis Ln
- 29 Waterview Cir
- 61 Old Phinneys Ln
- 45 Old Phinney's Ln
- 0 Indian Trail
- 22 Kent Rd
- 66 Tern Ln
- 54 Captain Cook Ln Unit 54
- 54 Captain Cook Ln
- 52 Packet Landing Way
- 16 Morgan Way
- 10 Black Duck Ln
- 2198 Main St
- 2198 Main
- 2160 Main St
- 2171 Main St
- 2159 Main Rte 6a St
- 2159 Main St
- 2159 Main St
- 34 Black Duck Ln Unit 92
- 2211 Main St
- 2211 Main St
- 2150 Main St
- 2150 Main Rte 6a ( Barn ) St
- 2225 Main St Rte 6a
- 2225 Main St
- 2225 Main St
- 2188 Main St
- 2145 Main
- 2145 Main St
- 0 Pilots Way Unit 20803251
Ask me questions while you tour the home.