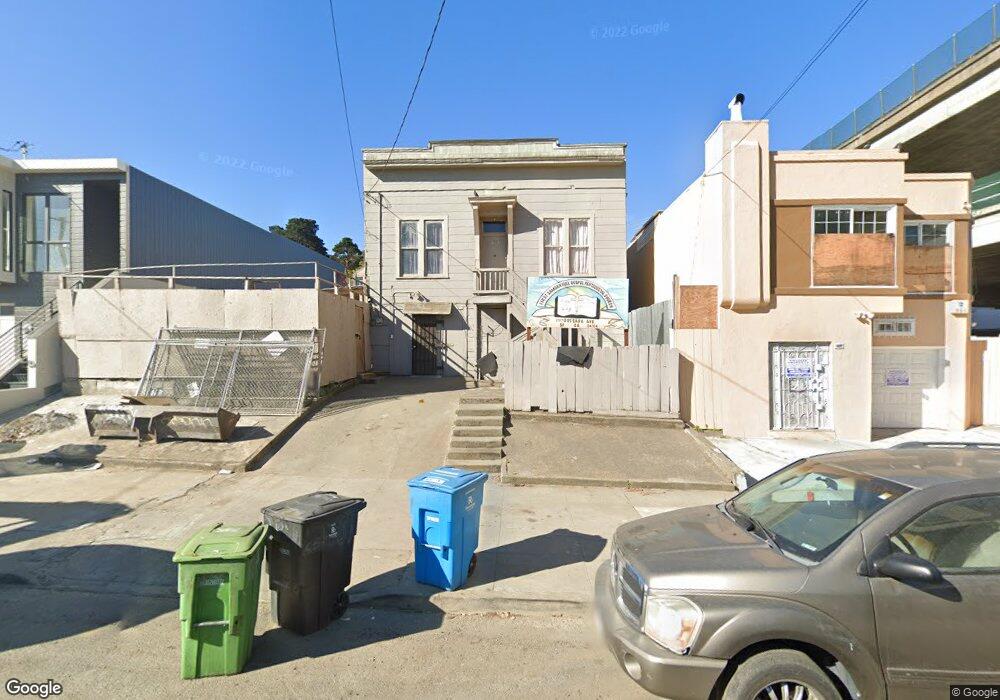
2187 Quesada Ave San Francisco, CA 94124
Silver Terrace NeighborhoodEstimated Value: $778,000 - $932,596
1
Bed
1
Bath
1,380
Sq Ft
$616/Sq Ft
Est. Value
About This Home
This home is located at 2187 Quesada Ave, San Francisco, CA 94124 and is currently estimated at $849,399, approximately $615 per square foot. 2187 Quesada Ave is a home located in San Francisco County with nearby schools including Dr. Charles R. Drew College Preparatory Academy, Willie L. Brown Jr. Middle School, and San Francisco School.
Ownership History
Date
Name
Owned For
Owner Type
Purchase Details
Closed on
Jan 7, 2013
Sold by
Seumaala Ululau M
Bought by
First Samoan Full Gospel Pentecostal Chu
Current Estimated Value
Purchase Details
Closed on
Feb 5, 2007
Sold by
Seumaala Lauifi
Bought by
Scumaala Ululau M
Home Financials for this Owner
Home Financials are based on the most recent Mortgage that was taken out on this home.
Original Mortgage
$455,000
Interest Rate
8.62%
Mortgage Type
Negative Amortization
Purchase Details
Closed on
Aug 8, 2006
Sold by
Vaesau Pusi
Bought by
Vaesau Faifili
Home Financials for this Owner
Home Financials are based on the most recent Mortgage that was taken out on this home.
Original Mortgage
$120,000
Interest Rate
6.76%
Mortgage Type
Stand Alone Second
Create a Home Valuation Report for This Property
The Home Valuation Report is an in-depth analysis detailing your home's value as well as a comparison with similar homes in the area
Home Values in the Area
Average Home Value in this Area
Purchase History
| Date | Buyer | Sale Price | Title Company |
|---|---|---|---|
| First Samoan Full Gospel Pentecostal Chu | -- | None Available | |
| Scumaala Ululau M | -- | North American Title Co | |
| Scumaala Ululau M | $700,000 | North American Title Co | |
| Vaesau Faifili | -- | North American Title Co | |
| Vacsau Faifili | $600,000 | North American Title Co |
Source: Public Records
Mortgage History
| Date | Status | Borrower | Loan Amount |
|---|---|---|---|
| Previous Owner | Scumaala Ululau M | $455,000 | |
| Previous Owner | Vacsau Faifili | $120,000 | |
| Previous Owner | Vaesau Faifili | $480,000 |
Source: Public Records
Tax History Compared to Growth
Tax History
| Year | Tax Paid | Tax Assessment Tax Assessment Total Assessment is a certain percentage of the fair market value that is determined by local assessors to be the total taxable value of land and additions on the property. | Land | Improvement |
|---|---|---|---|---|
| 2025 | -- | $517,185 | $362,032 | $155,153 |
| 2024 | -- | $507,045 | $354,934 | $152,111 |
| 2023 | -- | $497,104 | $347,975 | $149,129 |
| 2022 | $0 | $487,357 | $341,152 | $146,205 |
| 2021 | $0 | $477,802 | $334,463 | $143,339 |
| 2020 | $39 | $472,904 | $331,034 | $141,870 |
| 2019 | $38 | $463,633 | $324,544 | $139,089 |
| 2018 | $587 | $454,543 | $318,181 | $136,362 |
| 2017 | $281 | $445,632 | $311,943 | $133,689 |
| 2016 | -- | $436,895 | $305,827 | $131,068 |
| 2015 | $266 | $735,744 | $441,447 | $294,297 |
| 2014 | $374 | $721,333 | $432,800 | $288,533 |
Source: Public Records
Map
Nearby Homes
- 2147 Quesada Ave
- 1947 Palou Ave
- 1887 Oakdale Ave
- 1699 Quint St
- 1697 Quint St
- 130 Bridgeview Dr
- 200 Bayview Cir
- 1789 Mckinnon Ave
- 901 Bayshore Blvd Unit 311
- 1773-1775 Mckinnon Ave
- 555 Thornton Ave
- 332 Bradford St
- 71 Bradford St
- 80 Bronte St
- 81 Nebraska St
- 324 Topeka Ave
- 76 Putnam St
- 1739 Quesada Ave
- 236 Holladay Ave
- 215 Thornton Ave
- 2187 Quesada Ave
- 2195 Quesada Ave
- 2179 Quesada Ave
- 1425 Selby St
- 2171 Quesada Ave
- 2190 Revere Ave
- 2184 Revere Ave
- 2167 Quesada Ave
- 1445 Selby St
- 2170 Revere Ave
- 2163 Quesada Ave
- 2166 Revere Ave
- 2159 Quesada Ave
- 2186 Quesada Ave
- 2182 Quesada Ave
- 2162 Revere Ave
- 2178 Quesada Ave
- 2174 Quesada Ave
- 2155 Quesada Ave
- 2158 Revere Ave