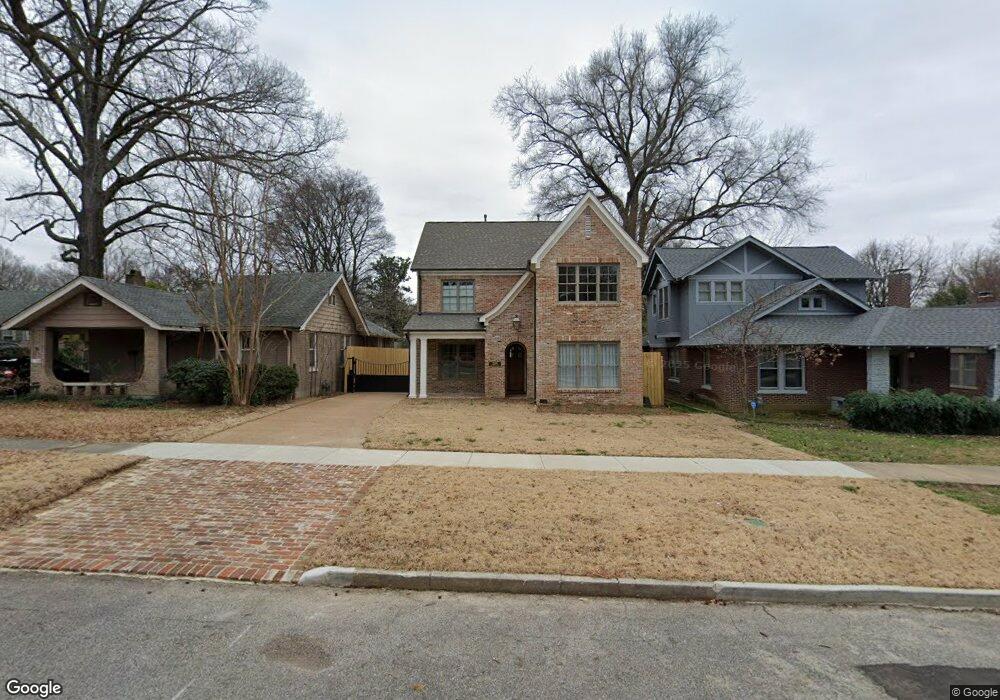
2189 Jefferson Ave Memphis, TN 38104
Midtown Memphis NeighborhoodEstimated Value: $315,000 - $703,918
3
Beds
5
Baths
3,638
Sq Ft
$147/Sq Ft
Est. Value
About This Home
This home is located at 2189 Jefferson Ave, Memphis, TN 38104 and is currently estimated at $535,480, approximately $147 per square foot. 2189 Jefferson Ave is a home located in Shelby County with nearby schools including Idlewild Elementary School, Central High School, and Compass Community School Binghampton Campus.
Ownership History
Date
Name
Owned For
Owner Type
Purchase Details
Closed on
Dec 27, 2012
Sold by
Adams Thomas P and Adams Bettye S
Bought by
Adams Courtenay E
Current Estimated Value
Purchase Details
Closed on
Aug 8, 2007
Sold by
Wexler Malone Stephanie
Bought by
Adams Bettye S and Adams Thomas P
Purchase Details
Closed on
Apr 30, 2002
Sold by
Burnette Emily J
Bought by
Wexler Stephanie L
Home Financials for this Owner
Home Financials are based on the most recent Mortgage that was taken out on this home.
Original Mortgage
$41,500
Interest Rate
7.18%
Purchase Details
Closed on
Jan 15, 2001
Sold by
Burnette John K
Bought by
Burnette Emily J
Purchase Details
Closed on
Jul 31, 1998
Sold by
Ryan Joan D
Bought by
Burnette John K and Burnette Emily J
Home Financials for this Owner
Home Financials are based on the most recent Mortgage that was taken out on this home.
Original Mortgage
$100,000
Interest Rate
6.96%
Purchase Details
Closed on
Dec 20, 1996
Sold by
Ryan Charles S
Bought by
Ryan Joan Denise Hortman
Create a Home Valuation Report for This Property
The Home Valuation Report is an in-depth analysis detailing your home's value as well as a comparison with similar homes in the area
Home Values in the Area
Average Home Value in this Area
Purchase History
| Date | Buyer | Sale Price | Title Company |
|---|---|---|---|
| Adams Courtenay E | -- | None Available | |
| Adams Bettye S | $152,500 | None Available | |
| Wexler Stephanie L | $133,500 | -- | |
| Burnette Emily J | -- | -- | |
| Burnette John K | $108,500 | -- | |
| Ryan Joan Denise Hortman | -- | -- |
Source: Public Records
Mortgage History
| Date | Status | Borrower | Loan Amount |
|---|---|---|---|
| Previous Owner | Wexler Stephanie L | $41,500 | |
| Previous Owner | Burnette John K | $100,000 |
Source: Public Records
Tax History Compared to Growth
Tax History
| Year | Tax Paid | Tax Assessment Tax Assessment Total Assessment is a certain percentage of the fair market value that is determined by local assessors to be the total taxable value of land and additions on the property. | Land | Improvement |
|---|---|---|---|---|
| 2025 | -- | $161,600 | $19,100 | $142,500 |
| 2024 | -- | $25,650 | $9,775 | $15,875 |
| 2023 | $595 | $9,775 | $9,775 | $0 |
| 2022 | $3,378 | $55,450 | $9,775 | $45,675 |
| 2021 | $3,417 | $55,450 | $9,775 | $45,675 |
| 2020 | $2,734 | $37,725 | $8,150 | $29,575 |
| 2019 | $2,734 | $37,725 | $8,150 | $29,575 |
| 2018 | $2,734 | $37,725 | $8,150 | $29,575 |
| 2017 | $1,551 | $37,725 | $8,150 | $29,575 |
| 2016 | $1,433 | $32,800 | $0 | $0 |
| 2014 | $1,433 | $32,800 | $0 | $0 |
Source: Public Records
Map
Nearby Homes
- 105 N Cox St
- 2176 Washington Ave
- 2111 Lee Place
- 15 S Cox St
- 2245 Madison Ave
- 2221 Poplar Ave
- 2186 Monroe Ave
- 2195 Poplar Ave Unit 306
- 2195 Poplar Ave Unit 405
- 2245 Monroe Ave
- 2277 Union Ave Unit 304
- 2277 Union Ave Unit 502
- 2277 Union Ave Unit 105
- 1997 Eastend Dr Unit 31
- 1993 Eastend Dr Unit 32
- 2096 Linden Ave
- 2092 Linden Ave
- 31 S Morrison St
- 1 Belleair Dr
- 35 Patricia Dr
- 2183 Jefferson Ave
- 2193 Jefferson Ave
- 2179 Jefferson Ave
- 2173 Jefferson Ave
- 75 N Cox St
- 67 N Cox St
- 2207 Jefferson Ave
- 69 N Cox St
- 61 N Cox St
- 63 N Cox St
- 2169 Jefferson Ave
- 2184 Court Ave
- 2190 Court Ave
- 2180 Court Ave
- 2194 Court Ave
- 55 N Cox St
- 2174 Court Ave
- 2176 Jefferson Ave
- 2165 Jefferson Ave
- 49 N Cox St