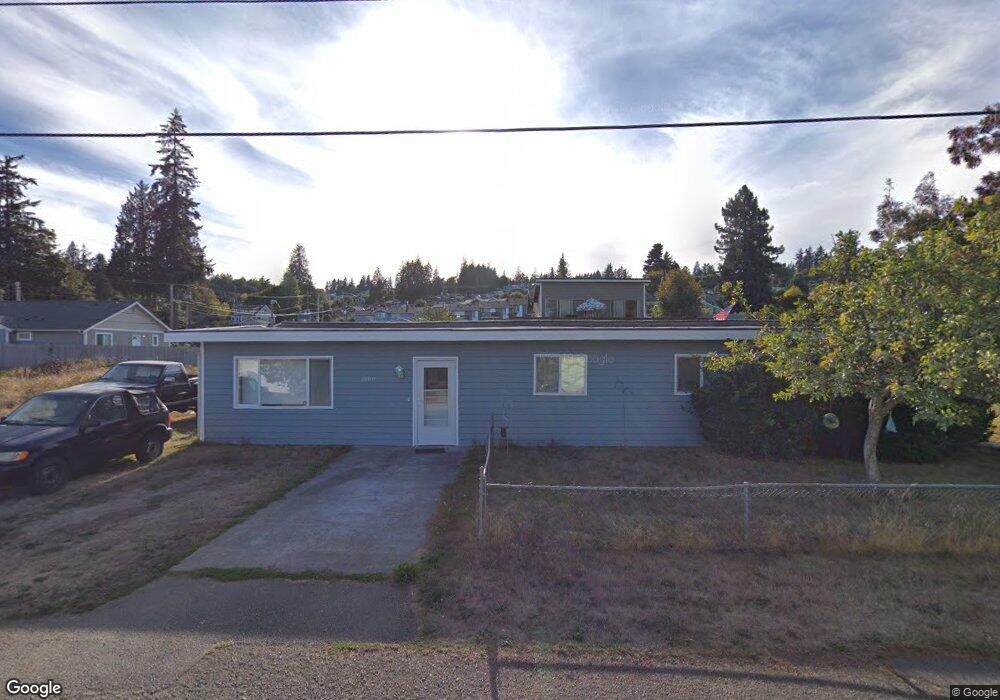
2189 Nubling Ave E Port Orchard, WA 98366
Manchester NeighborhoodEstimated Value: $416,000 - $538,000
4
Beds
2
Baths
1,440
Sq Ft
$316/Sq Ft
Est. Value
About This Home
This home is located at 2189 Nubling Ave E, Port Orchard, WA 98366 and is currently estimated at $455,429, approximately $316 per square foot. 2189 Nubling Ave E is a home located in Kitsap County with nearby schools including Manchester Elementary School, John Sedgwick Middle School, and South Kitsap High School.
Ownership History
Date
Name
Owned For
Owner Type
Purchase Details
Closed on
Mar 14, 2012
Sold by
Watkins Boyd D and Watkins Susan C
Bought by
Fry Joshua D and Fry Casey
Current Estimated Value
Home Financials for this Owner
Home Financials are based on the most recent Mortgage that was taken out on this home.
Original Mortgage
$142,907
Outstanding Balance
$97,980
Interest Rate
3.83%
Mortgage Type
VA
Estimated Equity
$357,449
Purchase Details
Closed on
Feb 11, 2002
Sold by
Va
Bought by
Watkins Boyd D and Watkins Susan C
Home Financials for this Owner
Home Financials are based on the most recent Mortgage that was taken out on this home.
Original Mortgage
$72,000
Interest Rate
7.04%
Mortgage Type
Seller Take Back
Purchase Details
Closed on
Jun 12, 2001
Sold by
Wells Fargo Home Mtg Inc
Bought by
Va
Purchase Details
Closed on
Apr 9, 1997
Sold by
Metzdorf Dewey W
Bought by
Chapin Randal D
Home Financials for this Owner
Home Financials are based on the most recent Mortgage that was taken out on this home.
Original Mortgage
$88,638
Interest Rate
7.66%
Mortgage Type
VA
Create a Home Valuation Report for This Property
The Home Valuation Report is an in-depth analysis detailing your home's value as well as a comparison with similar homes in the area
Home Values in the Area
Average Home Value in this Area
Purchase History
| Date | Buyer | Sale Price | Title Company |
|---|---|---|---|
| Fry Joshua D | $140,180 | First American Title Ins | |
| Watkins Boyd D | -- | Transnation Title Ins Co | |
| Va | -- | First American Title Ins | |
| Wells Fargo Home Mtg Inc | $74,030 | First American Title Ins | |
| Chapin Randal D | $86,900 | Charter Title Corp |
Source: Public Records
Mortgage History
| Date | Status | Borrower | Loan Amount |
|---|---|---|---|
| Open | Fry Joshua D | $142,907 | |
| Previous Owner | Watkins Boyd D | $72,000 | |
| Previous Owner | Chapin Randal D | $88,638 |
Source: Public Records
Tax History Compared to Growth
Tax History
| Year | Tax Paid | Tax Assessment Tax Assessment Total Assessment is a certain percentage of the fair market value that is determined by local assessors to be the total taxable value of land and additions on the property. | Land | Improvement |
|---|---|---|---|---|
| 2026 | $2,836 | $321,500 | $88,200 | $233,300 |
| 2025 | $2,836 | $321,500 | $88,200 | $233,300 |
| 2024 | $2,750 | $321,500 | $88,200 | $233,300 |
| 2023 | $2,729 | $321,500 | $88,200 | $233,300 |
| 2022 | $2,628 | $259,060 | $70,440 | $188,620 |
| 2021 | $2,436 | $227,050 | $61,250 | $165,800 |
| 2020 | $2,438 | $221,180 | $57,730 | $163,450 |
| 2019 | $2,105 | $209,620 | $54,570 | $155,050 |
| 2018 | $2,213 | $167,400 | $47,360 | $120,040 |
| 2017 | $1,852 | $167,400 | $47,360 | $120,040 |
| 2016 | $1,826 | $151,140 | $45,100 | $106,040 |
| 2015 | $1,767 | $148,340 | $45,100 | $103,240 |
| 2014 | -- | $136,490 | $45,640 | $90,850 |
| 2013 | -- | $136,490 | $45,640 | $90,850 |
Source: Public Records
Map
Nearby Homes
- 8079 E Main St Unit 341
- 2372 Valley Ave E
- 7748 E Hemlock St
- 7549 E Alki View Ct
- 6418 E Royalview Ln
- 2440 Alaska Ave E
- 2585 Alaska Ave E
- 1630 & 1632 Colchester Dr E
- 7548 E Grandview St
- 8623 E Caraway Rd
- 8471 E Caraway Rd
- 8009 E Commons Ct
- 8609 E Caraway Rd
- 7590 E Idaho St
- 1083 Puget Dr E
- 7569 E Montana St
- 7579 E Idaho St
- 8185 E Seaview Dr
- 7260 E Last Refuge Way
- 1738 Lilypad Place E
- 8098 E Spruce St
- 2201 Nubling Ave E
- 8093 E Spruce St
- 2221 Nubling Ave E
- 8111 E Hemlock St
- 2239 Colchester Dr E
- 8095 E Hemlock St
- 2179 Nubling Ave E
- 2163 Nubling Ave E
- 2319 Nubling Ave E
- 2265 Colchester Dr E
- 2220 Colchester Dr E
- 8193 E Hemlock St
- 2236 Colchester Dr E
- 8077 E Hemlock St
- 8050 E Spruce St
- 8160 E Hemlock St
- 8100 E Hemlock St
- 2343 Denniston Ln E
- 8168 E Hemlock St