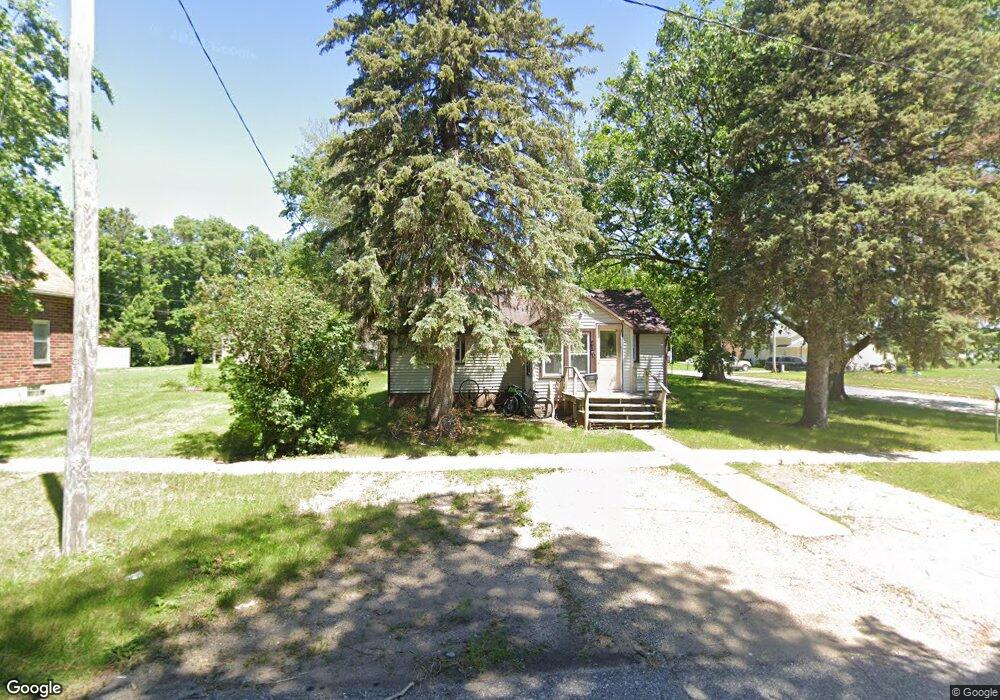
219 7th Ave SE Clarion, IA 50525
Estimated Value: $58,009 - $74,000
2
Beds
1
Bath
576
Sq Ft
$117/Sq Ft
Est. Value
About This Home
This home is located at 219 7th Ave SE, Clarion, IA 50525 and is currently estimated at $67,252, approximately $116 per square foot. 219 7th Ave SE is a home with nearby schools including Clarion-Goldfield-Dows Elementary School, Clarion-Goldfield-Dows Middle School, and Clarion-Goldfield-Dows High School.
Ownership History
Date
Name
Owned For
Owner Type
Purchase Details
Closed on
May 26, 2023
Sold by
Zamora Josefa and Acuna Ulysses
Bought by
Sanchez Arturo
Current Estimated Value
Purchase Details
Closed on
Jan 13, 2020
Sold by
Lynnda L Purcell Ret
Bought by
Zamora Josefa
Home Financials for this Owner
Home Financials are based on the most recent Mortgage that was taken out on this home.
Original Mortgage
$28,200
Interest Rate
3.73%
Mortgage Type
New Conventional
Create a Home Valuation Report for This Property
The Home Valuation Report is an in-depth analysis detailing your home's value as well as a comparison with similar homes in the area
Home Values in the Area
Average Home Value in this Area
Purchase History
| Date | Buyer | Sale Price | Title Company |
|---|---|---|---|
| Sanchez Arturo | $30,000 | None Listed On Document | |
| Zamora Josefa | $27,500 | None Available |
Source: Public Records
Mortgage History
| Date | Status | Borrower | Loan Amount |
|---|---|---|---|
| Previous Owner | Zamora Josefa | $28,200 |
Source: Public Records
Tax History Compared to Growth
Tax History
| Year | Tax Paid | Tax Assessment Tax Assessment Total Assessment is a certain percentage of the fair market value that is determined by local assessors to be the total taxable value of land and additions on the property. | Land | Improvement |
|---|---|---|---|---|
| 2025 | $746 | $35,900 | $7,800 | $28,100 |
| 2024 | $746 | $38,900 | $7,800 | $31,100 |
| 2023 | $764 | $38,900 | $7,800 | $31,100 |
| 2022 | $662 | $33,700 | $7,800 | $25,900 |
| 2021 | $662 | $29,400 | $7,800 | $21,600 |
| 2020 | $662 | $29,400 | $7,800 | $21,600 |
| 2019 | $612 | $27,300 | $0 | $0 |
| 2018 | $616 | $27,300 | $0 | $0 |
| 2017 | $588 | $26,200 | $0 | $0 |
| 2016 | $566 | $26,200 | $0 | $0 |
| 2015 | $540 | $26,200 | $0 | $0 |
| 2014 | $540 | $27,100 | $0 | $0 |
Source: Public Records
Map
Nearby Homes
- 219 8th Ave SE
- 1000 1st St SE
- 708 2nd St SW
- 1221 S Main St
- 614 Central Ave E
- 213 8th St SE
- 603 1st Ave NE
- 421 2nd Ave NE
- 314 1st St NW
- 909 1st Ave SE
- 212 3rd Ave NE
- 903 2nd Ave NE
- 904 3rd Ave NE
- 1003 2nd Ave NE
- 620 Maple Ln
- 719 2nd St NE
- 306 White Fox Dr
- 2412 188th St
- 2405 186th St Unit 1
- 2405 186th St Unit 2