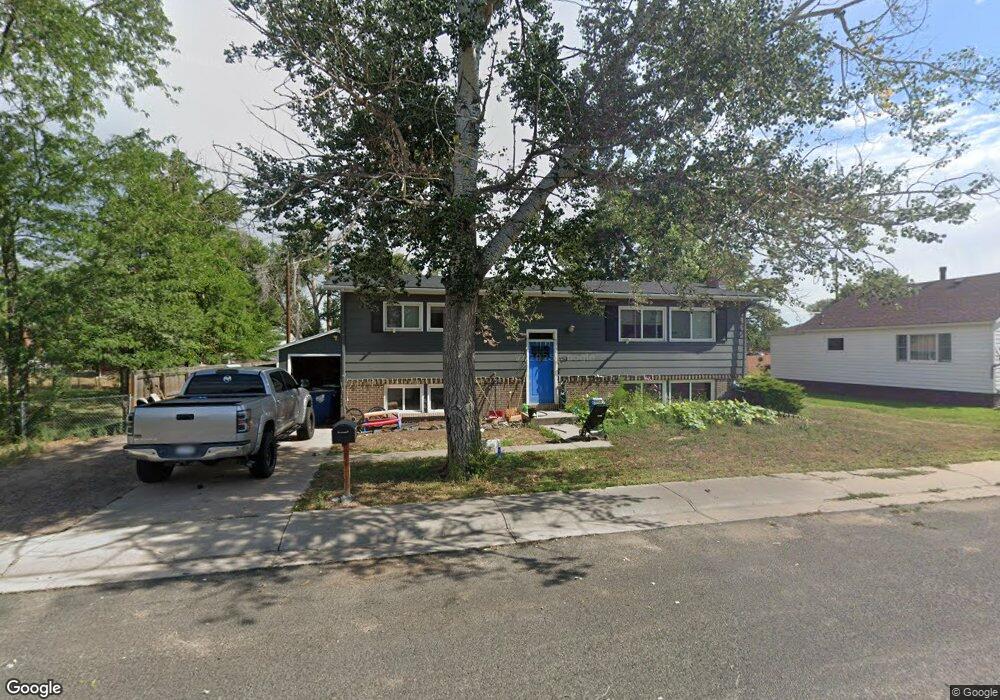
219 8th St Fort Lupton, CO 80621
Estimated Value: $414,000 - $497,000
4
Beds
2
Baths
2,208
Sq Ft
$199/Sq Ft
Est. Value
About This Home
This home is located at 219 8th St, Fort Lupton, CO 80621 and is currently estimated at $438,601, approximately $198 per square foot. 219 8th St is a home located in Weld County with nearby schools including Leo William Butler Elementary School, Fort Lupton Middle School, and Fort Lupton High School.
Ownership History
Date
Name
Owned For
Owner Type
Purchase Details
Closed on
May 8, 2017
Sold by
Duke Partners Ii Llc
Bought by
Ostrander Leah E and Lujan Jordan
Current Estimated Value
Home Financials for this Owner
Home Financials are based on the most recent Mortgage that was taken out on this home.
Original Mortgage
$284,648
Outstanding Balance
$234,442
Interest Rate
4.1%
Mortgage Type
FHA
Estimated Equity
$204,159
Purchase Details
Closed on
Sep 9, 2016
Sold by
Garcia Mario and Garcia Robin
Bought by
Jpmorgane Chase Bank Na
Purchase Details
Closed on
Jun 27, 2005
Sold by
Morales Michael L and Morales Anne V
Bought by
Garcia Mario and Garcia Robin
Home Financials for this Owner
Home Financials are based on the most recent Mortgage that was taken out on this home.
Original Mortgage
$143,920
Interest Rate
7.3%
Mortgage Type
Fannie Mae Freddie Mac
Purchase Details
Closed on
May 5, 1995
Sold by
Morales Micel Albert
Bought by
Morales Michael L and Morales Annie V
Purchase Details
Closed on
Apr 25, 1995
Purchase Details
Closed on
Oct 17, 1983
Create a Home Valuation Report for This Property
The Home Valuation Report is an in-depth analysis detailing your home's value as well as a comparison with similar homes in the area
Home Values in the Area
Average Home Value in this Area
Purchase History
| Date | Buyer | Sale Price | Title Company |
|---|---|---|---|
| Ostrander Leah E | $289,900 | None Available | |
| Jpmorgane Chase Bank Na | -- | None Available | |
| Garcia Mario | $179,900 | -- | |
| Morales Michael L | $79,000 | -- | |
| -- | -- | -- | |
| -- | -- | -- |
Source: Public Records
Mortgage History
| Date | Status | Borrower | Loan Amount |
|---|---|---|---|
| Open | Ostrander Leah E | $284,648 | |
| Previous Owner | Garcia Mario | $143,920 |
Source: Public Records
Tax History
| Year | Tax Paid | Tax Assessment Tax Assessment Total Assessment is a certain percentage of the fair market value that is determined by local assessors to be the total taxable value of land and additions on the property. | Land | Improvement |
|---|---|---|---|---|
| 2025 | $2,193 | $24,780 | $4,000 | $20,780 |
| 2024 | $2,193 | $24,780 | $4,000 | $20,780 |
| 2023 | $1,943 | $26,610 | $4,330 | $22,280 |
| 2022 | $2,026 | $22,430 | $2,220 | $20,210 |
| 2021 | $2,315 | $23,080 | $2,290 | $20,790 |
| 2020 | $1,835 | $20,540 | $2,220 | $18,320 |
| 2019 | $1,826 | $20,540 | $2,220 | $18,320 |
| 2018 | $1,402 | $15,730 | $1,580 | $14,150 |
| 2017 | $1,468 | $15,730 | $1,580 | $14,150 |
| 2016 | $1,110 | $12,550 | $1,270 | $11,280 |
| 2015 | $1,018 | $12,550 | $1,270 | $11,280 |
| 2014 | $828 | $9,560 | $1,270 | $8,290 |
Source: Public Records
Map
Nearby Homes
- 0 8th St
- 111 7th St
- 229 4th St
- 234 4th St
- 229 Mckinley Ave
- 150 Fulton Ave
- 200 2nd St
- 113 Park Ave
- 0 Grand Ave Unit 2
- 145 S Park Ave
- 908 Trapper Dr
- 203 S Park Ave
- 0 Lane Ct
- 910 Lancaster Ave
- 302 S Mckinley Ave
- 0 County Road 14 1 2
- 328 S Mckinley Ave
- 1113 Lantern Dr
- 1401 9th St Unit 163
- 247 S Grand Ave
Your Personal Tour Guide
Ask me questions while you tour the home.