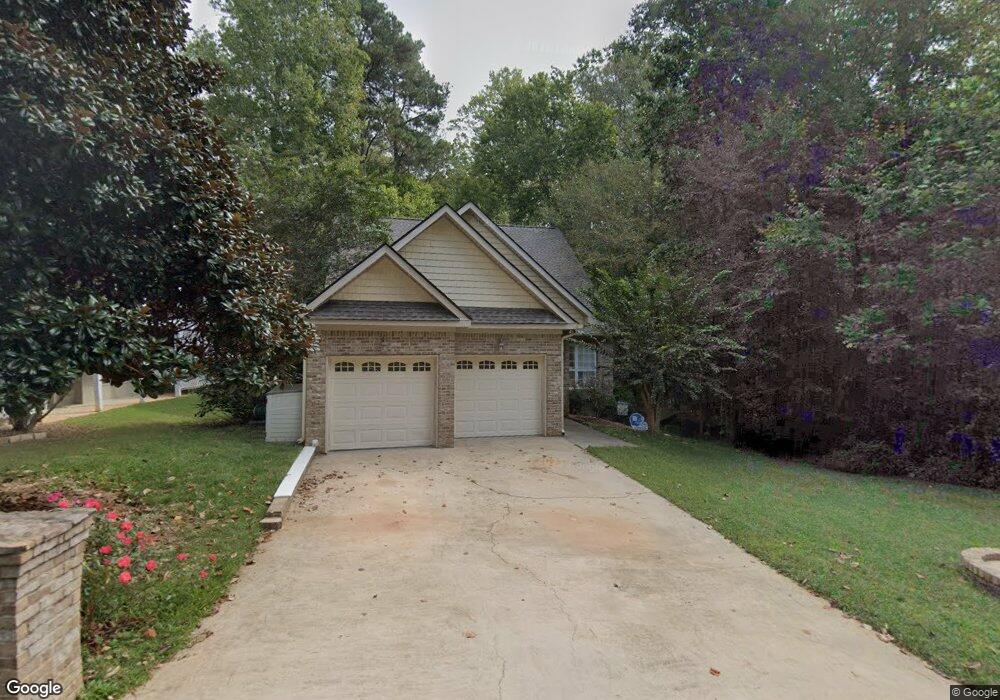
219 Creek View Rd Bremen, GA 30110
Estimated Value: $286,000 - $353,000
3
Beds
3
Baths
1,782
Sq Ft
$177/Sq Ft
Est. Value
About This Home
This home is located at 219 Creek View Rd, Bremen, GA 30110 and is currently estimated at $314,848, approximately $176 per square foot. 219 Creek View Rd is a home located in Haralson County with nearby schools including Jones Elementary School, Bremen 4th & 5th Grade Academy, and Bremen Middle School.
Ownership History
Date
Name
Owned For
Owner Type
Purchase Details
Closed on
Mar 29, 2019
Sold by
Burrell Raymond
Bought by
Maddox Johnson Kevin L and Maddox Johnson Elizabeth
Current Estimated Value
Home Financials for this Owner
Home Financials are based on the most recent Mortgage that was taken out on this home.
Original Mortgage
$132,000
Outstanding Balance
$116,051
Interest Rate
4.3%
Mortgage Type
New Conventional
Estimated Equity
$198,797
Purchase Details
Closed on
Dec 30, 2005
Sold by
Lansford Edgar B and Lansford Paula E
Bought by
Burrell Raymond
Purchase Details
Closed on
Sep 16, 2004
Sold by
Shepard Travis D
Bought by
Lansford Edgar B and Lansford Paula E
Purchase Details
Closed on
Jun 6, 2003
Sold by
Marriott Wendy P
Bought by
Shepard Travis D
Purchase Details
Closed on
May 22, 2002
Sold by
Home Town Bank Of Villa Rica
Bought by
Wgag Development Company Llc
Create a Home Valuation Report for This Property
The Home Valuation Report is an in-depth analysis detailing your home's value as well as a comparison with similar homes in the area
Home Values in the Area
Average Home Value in this Area
Purchase History
| Date | Buyer | Sale Price | Title Company |
|---|---|---|---|
| Maddox Johnson Kevin L | $165,000 | -- | |
| Burrell Raymond | $192,500 | -- | |
| Lansford Edgar B | $179,900 | -- | |
| Lansford Edgar B | $179,900 | -- | |
| Shepard Travis D | $143,600 | -- | |
| Wgag Development Company Llc | -- | -- | |
| Marriott Wendy P | $139,900 | -- |
Source: Public Records
Mortgage History
| Date | Status | Borrower | Loan Amount |
|---|---|---|---|
| Open | Maddox Johnson Kevin L | $132,000 |
Source: Public Records
Tax History Compared to Growth
Tax History
| Year | Tax Paid | Tax Assessment Tax Assessment Total Assessment is a certain percentage of the fair market value that is determined by local assessors to be the total taxable value of land and additions on the property. | Land | Improvement |
|---|---|---|---|---|
| 2024 | $2,722 | $97,508 | $9,600 | $87,908 |
| 2023 | $3,033 | $101,542 | $9,600 | $91,942 |
| 2022 | $779 | $82,767 | $9,600 | $73,167 |
| 2021 | $710 | $72,284 | $9,408 | $62,876 |
| 2020 | $672 | $66,198 | $9,600 | $56,598 |
| 2019 | $669 | $63,715 | $9,600 | $54,115 |
| 2018 | $645 | $60,599 | $9,600 | $50,999 |
| 2017 | $1,952 | $56,865 | $9,600 | $47,265 |
| 2016 | $624 | $50,266 | $9,600 | $40,666 |
| 2015 | $626 | $50,165 | $9,600 | $40,565 |
| 2014 | $819 | $61,328 | $11,900 | $49,428 |
Source: Public Records
Map
Nearby Homes
- 305 Crest Pointe S
- 153 Crest Pointe
- 138 Crest Pointe
- 327 Crest Pointe S
- 321 Stonebridge Blvd
- 201 Stonebridge Blvd
- 853 Brown Thrasher Way
- 0 Mt Zion St Unit 7399245
- 504 Silver Leaf Pkwy
- 112 Summit Ln
- 601 Hydrangea Ln
- 0 Stonebridge Blvd Unit 143588
- 1401 Alabama Ave
- 812 Brown Thrasher Way
- 805 Brown Thrasher Way
- The Rose Plan at Creekside at Magnolia
- The Hudson Plan at Creekside at Magnolia
- 225 Edwards St
- 219 Creek View Rd Unit 10,11A
- 217 Creek View Rd
- 223 Creek View Rd
- 206 Creek View Rd
- 215 Creek View Rd
- 210 Creek View Rd
- 225 Creek View Rd
- 204 Creek View Rd
- 212 Creek View Rd
- 213 Creek View Rd
- 211 Creek View Rd
- 202 Creek View Rd
- 209 Creek View Rd
- 200 Creek View Rd Unit 20
- 200 Creek View Rd
- 207 Creek View Rd
- 205 Creek View Rd
- 0 Creek View Rd Unit 7196504
- 0 Creek View Rd Unit 7116721
- 0 Creek View Rd Unit 3176260