Estimated Value: $1,475,000 - $1,627,000
5
Beds
5
Baths
5,073
Sq Ft
$307/Sq Ft
Est. Value
About This Home
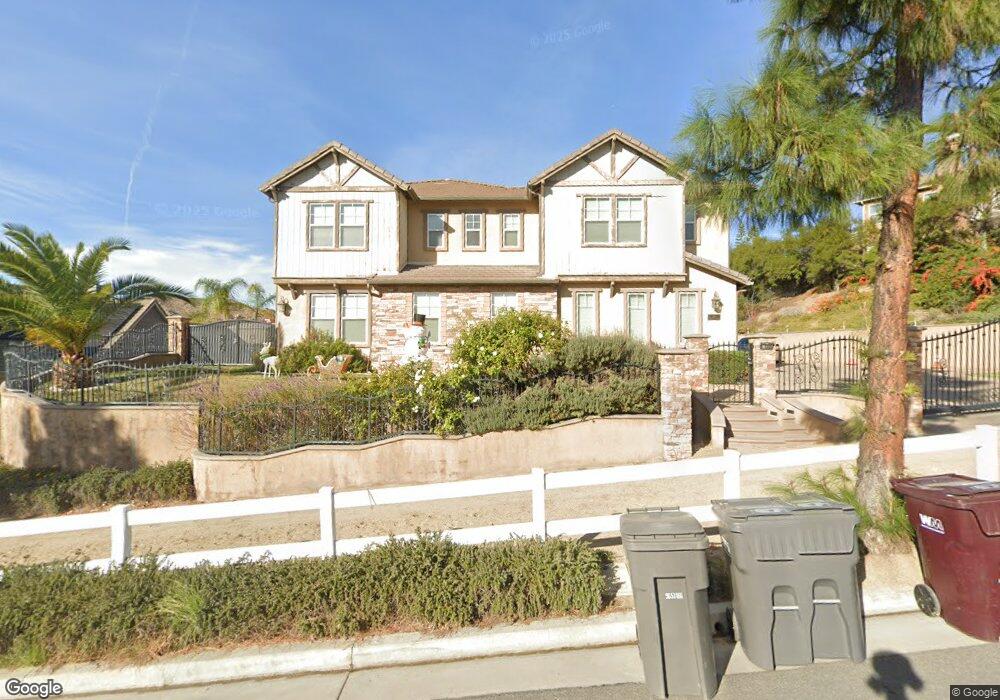
This home is located at 219 Cross Rail Ln, Norco, CA 92860 and is currently estimated at $1,557,511, approximately $307 per square foot. 219 Cross Rail Ln is a home located in Riverside County with nearby schools including Norco Elementary, Norco Intermediate School, and Norco High School.
Ownership History
Date
Name
Owned For
Owner Type
Purchase Details
Closed on
Aug 29, 2008
Sold by
U S Bank Na
Bought by
Langdon John and Langdon Jeanne
Current Estimated Value
Purchase Details
Closed on
Jan 7, 2008
Sold by
Medina Stacey Ann
Bought by
U S Bank Na and Master Adjustable Rate Mortgages Trust 2
Purchase Details
Closed on
Dec 28, 2007
Sold by
Medina Stacey Ann
Bought by
Countrywide Bank Na
Purchase Details
Closed on
Mar 2, 2006
Sold by
Medina Louie
Bought by
Medina Stacey Ann
Purchase Details
Closed on
Nov 22, 2004
Sold by
Lb/L Pacer Ii Norco 122 Llc
Bought by
Whitman Stacey Ann
Home Financials for this Owner
Home Financials are based on the most recent Mortgage that was taken out on this home.
Original Mortgage
$683,750
Interest Rate
4.87%
Mortgage Type
Purchase Money Mortgage
Create a Home Valuation Report for This Property
The Home Valuation Report is an in-depth analysis detailing your home's value as well as a comparison with similar homes in the area
Home Values in the Area
Average Home Value in this Area
Purchase History
| Date | Buyer | Sale Price | Title Company |
|---|---|---|---|
| Langdon John | $610,000 | Landsafe Title San Bernardin | |
| U S Bank Na | $989,000 | Landsafe Title | |
| Countrywide Bank Na | -- | None Available | |
| Medina Stacey Ann | -- | Ticor Title | |
| Medina Stacey Ann | -- | Ticor Title | |
| Whitman Stacey Ann | $977,000 | Fidelity National Title Co |
Source: Public Records
Mortgage History
| Date | Status | Borrower | Loan Amount |
|---|---|---|---|
| Previous Owner | Whitman Stacey Ann | $683,750 | |
| Closed | Whitman Stacey Ann | $195,350 |
Source: Public Records
Tax History Compared to Growth
Tax History
| Year | Tax Paid | Tax Assessment Tax Assessment Total Assessment is a certain percentage of the fair market value that is determined by local assessors to be the total taxable value of land and additions on the property. | Land | Improvement |
|---|---|---|---|---|
| 2025 | $15,331 | $861,444 | $206,028 | $655,416 |
| 2023 | $15,331 | $827,995 | $198,029 | $629,966 |
| 2022 | $14,797 | $811,761 | $194,147 | $617,614 |
| 2021 | $14,467 | $795,845 | $190,341 | $605,504 |
| 2020 | $14,274 | $787,686 | $188,390 | $599,296 |
| 2019 | $13,956 | $772,243 | $184,697 | $587,546 |
| 2018 | $13,599 | $757,102 | $181,077 | $576,025 |
| 2017 | $13,851 | $742,258 | $177,527 | $564,731 |
| 2016 | $13,781 | $727,705 | $174,047 | $553,658 |
| 2015 | $13,645 | $716,777 | $171,434 | $545,343 |
| 2014 | $13,233 | $695,000 | $166,000 | $529,000 |
Source: Public Records
Map
Nearby Homes
- 190 Cross Rail Ln
- 200 Cross Rail Ln
- 229 Oldenburg Ln
- 59 Oldenburg Ln
- 1111 La Salle Cir
- 1020 La Salle Cir
- 2622 Presidio Ln
- 2130 Almeria St Unit 105
- 12221 Dewar Dr
- 2110 Almeria St Unit 106
- 1995 Las Colinas Cir Unit 104
- 1995 Las Colinas Cir Unit 307
- 2265 Indigo Hills Dr Unit 6
- 2960 La Vista Ave
- 2599 Pinnacle Cir
- 12179 Dewar Dr
- 1980 Las Colinas Cir Unit 301
- 1980 Las Colinas Cir Unit 208
- 1096 Casandra Ln
- 2225 Indigo Hills Dr Unit 3
- 229 Cross Rail Ln
- 209 Cross Rail Ln
- 239 Cross Rail Ln
- 199 Cross Rail Ln
- 220 Cross Rail Ln
- 230 Cross Rail Ln
- 249 Cross Rail Ln
- 210 Cross Rail Ln
- 189 Cross Rail Ln
- 240 Cross Rail Ln
- 259 Cross Rail Ln
- 179 Cross Rail Ln
- 180 Cross Rail Ln
- 250 Cross Rail Ln
- 209 Haflinger Rd
- 199 Haflinger Rd
- 269 Cross Rail Ln
- 219 Haflinger Rd
- 169 Cross Rail Ln
- 229 Haflinger Rd