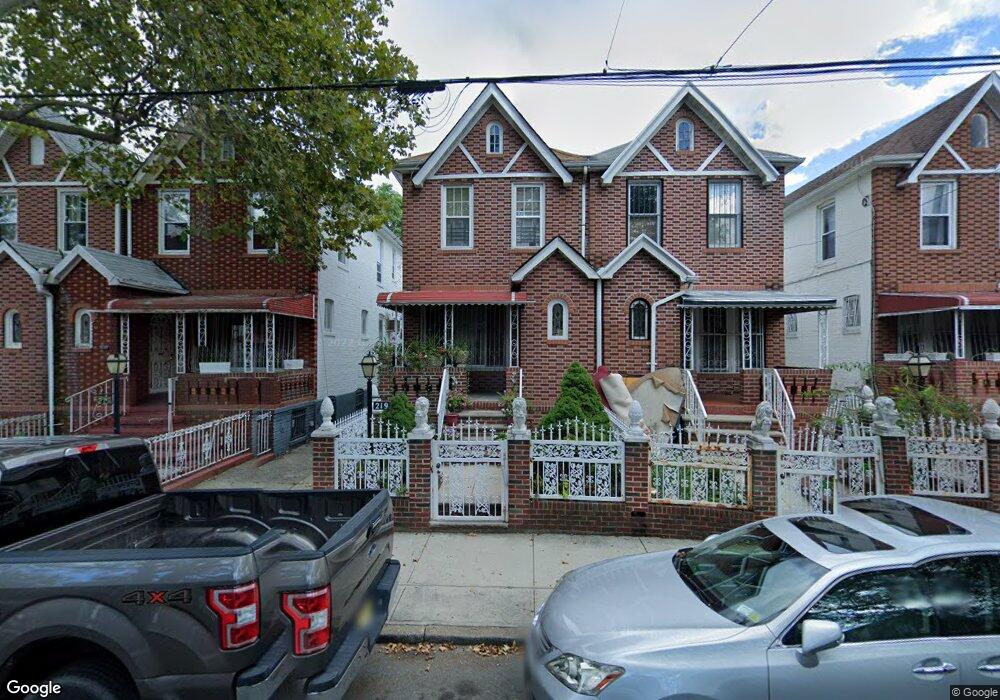
219 E 58th St Brooklyn, NY 11203
East Flatbush NeighborhoodEstimated Value: $663,000 - $990,000
Studio
--
Bath
1,600
Sq Ft
$491/Sq Ft
Est. Value
About This Home
This home is located at 219 E 58th St, Brooklyn, NY 11203 and is currently estimated at $786,118, approximately $491 per square foot. 219 E 58th St is a home located in Kings County with nearby schools including Ps 244 Richard R Green, I.S. 285 Meyer Levin, and Ivy Hill Preparatory Charter School.
Ownership History
Date
Name
Owned For
Owner Type
Purchase Details
Closed on
Mar 4, 2011
Sold by
Blackwood Herma S
Bought by
Williams Sharon L and Williams Travis D
Current Estimated Value
Home Financials for this Owner
Home Financials are based on the most recent Mortgage that was taken out on this home.
Original Mortgage
$409,559
Outstanding Balance
$282,070
Interest Rate
4.84%
Mortgage Type
Purchase Money Mortgage
Estimated Equity
$504,048
Create a Home Valuation Report for This Property
The Home Valuation Report is an in-depth analysis detailing your home's value as well as a comparison with similar homes in the area
Home Values in the Area
Average Home Value in this Area
Purchase History
| Date | Buyer | Sale Price | Title Company |
|---|---|---|---|
| Williams Sharon L | $413,000 | -- |
Source: Public Records
Mortgage History
| Date | Status | Borrower | Loan Amount |
|---|---|---|---|
| Open | Williams Sharon L | $409,559 |
Source: Public Records
Tax History
| Year | Tax Paid | Tax Assessment Tax Assessment Total Assessment is a certain percentage of the fair market value that is determined by local assessors to be the total taxable value of land and additions on the property. | Land | Improvement |
|---|---|---|---|---|
| 2025 | $5,937 | $43,320 | $13,380 | $29,940 |
| 2024 | $5,937 | $39,900 | $13,380 | $26,520 |
| 2023 | $6,003 | $34,980 | $13,380 | $21,600 |
| 2022 | $5,713 | $37,980 | $13,380 | $24,600 |
| 2021 | $5,781 | $32,580 | $13,380 | $19,200 |
| 2020 | $2,702 | $25,800 | $13,380 | $12,420 |
| 2019 | $5,104 | $25,800 | $13,380 | $12,420 |
| 2018 | $5,114 | $26,547 | $10,278 | $16,269 |
| 2017 | $4,806 | $25,048 | $10,952 | $14,096 |
| 2016 | $4,674 | $24,931 | $13,020 | $11,911 |
| 2015 | $2,630 | $23,520 | $14,880 | $8,640 |
| 2014 | $2,630 | $23,450 | $12,615 | $10,835 |
Source: Public Records
Map
Nearby Homes