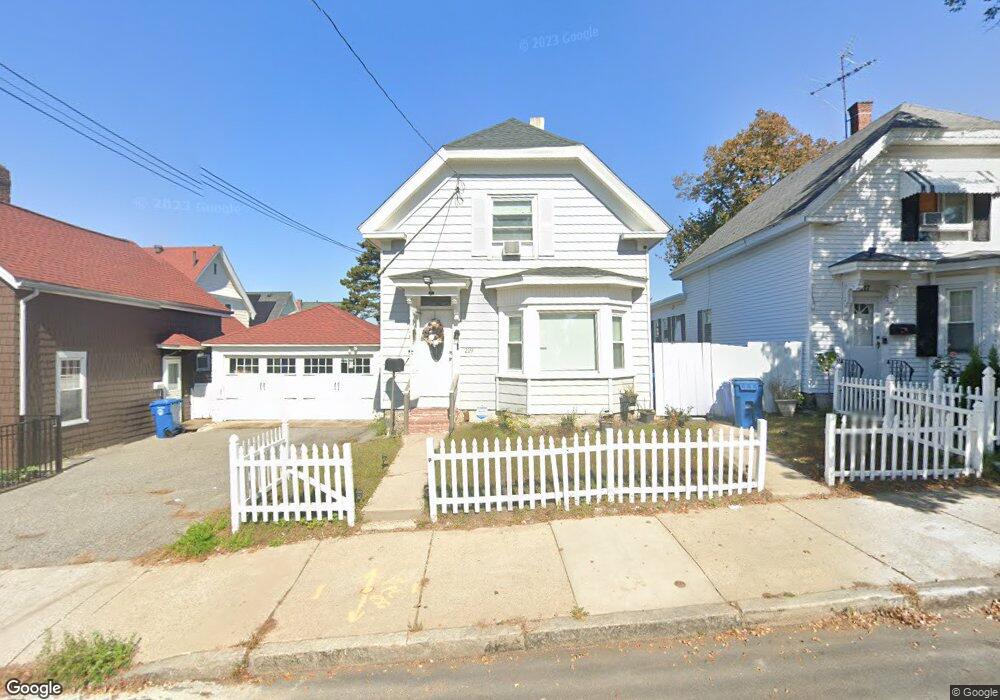
219 Ferry St Unit 1 Lawrence, MA 01841
Prospect Hill-Back Bay NeighborhoodEstimated Value: $443,000 - $558,000
3
Beds
1
Bath
1,264
Sq Ft
$392/Sq Ft
Est. Value
About This Home
This home is located at 219 Ferry St Unit 1, Lawrence, MA 01841 and is currently estimated at $495,641, approximately $392 per square foot. 219 Ferry St Unit 1 is a home located in Essex County with nearby schools including School For Exceptional Studies, Community Day Charter Public School - Gateway, and Esperanza Academy School of Hope.
Ownership History
Date
Name
Owned For
Owner Type
Purchase Details
Closed on
Jun 14, 2022
Sold by
Mercado Juan and Mercado Maria D
Bought by
Delossantos Loranny G and Perez Yolainny
Current Estimated Value
Home Financials for this Owner
Home Financials are based on the most recent Mortgage that was taken out on this home.
Original Mortgage
$417,302
Outstanding Balance
$394,134
Interest Rate
5.1%
Mortgage Type
FHA
Estimated Equity
$101,507
Purchase Details
Closed on
Nov 23, 2020
Sold by
Mercado Juan and Mercado Maria D
Bought by
Mercado Juan and Mercado Maria D
Home Financials for this Owner
Home Financials are based on the most recent Mortgage that was taken out on this home.
Original Mortgage
$104,000
Interest Rate
2.8%
Mortgage Type
New Conventional
Purchase Details
Closed on
Jan 12, 2006
Sold by
Pelczar Theresa
Bought by
Mercado Juan
Home Financials for this Owner
Home Financials are based on the most recent Mortgage that was taken out on this home.
Original Mortgage
$145,600
Interest Rate
6.28%
Mortgage Type
Purchase Money Mortgage
Create a Home Valuation Report for This Property
The Home Valuation Report is an in-depth analysis detailing your home's value as well as a comparison with similar homes in the area
Home Values in the Area
Average Home Value in this Area
Purchase History
| Date | Buyer | Sale Price | Title Company |
|---|---|---|---|
| Delossantos Loranny G | $425,000 | None Available | |
| Mercado Juan | -- | None Available | |
| Mercado Juan | $182,000 | -- | |
| Mercado Juan | $182,000 | -- |
Source: Public Records
Mortgage History
| Date | Status | Borrower | Loan Amount |
|---|---|---|---|
| Open | Delossantos Loranny G | $417,302 | |
| Previous Owner | Mercado Juan | $104,000 | |
| Previous Owner | Mercado Juan | $145,600 |
Source: Public Records
Tax History
| Year | Tax Paid | Tax Assessment Tax Assessment Total Assessment is a certain percentage of the fair market value that is determined by local assessors to be the total taxable value of land and additions on the property. | Land | Improvement |
|---|---|---|---|---|
| 2025 | $3,448 | $391,800 | $152,000 | $239,800 |
| 2024 | $3,033 | $327,900 | $131,600 | $196,300 |
| 2023 | $3,316 | $326,400 | $131,600 | $194,800 |
| 2022 | $3,066 | $268,000 | $117,400 | $150,600 |
| 2021 | $3,007 | $245,100 | $117,400 | $127,700 |
| 2020 | $3,024 | $243,300 | $115,600 | $127,700 |
| 2019 | $2,840 | $207,600 | $92,300 | $115,300 |
| 2018 | $2,628 | $183,500 | $88,000 | $95,500 |
| 2017 | $2,542 | $165,700 | $81,200 | $84,500 |
| 2016 | $2,451 | $158,000 | $72,700 | $85,300 |
| 2015 | $2,170 | $143,500 | $58,200 | $85,300 |
Source: Public Records
Map
Nearby Homes
- 14 Court St
- 39 Swan Ave
- 12 Annette St
- 25-27 Bicknell Ave
- 106 Leroy Ave
- 18 Erhardt Terrace
- 7 Erhardt Terrace
- 264 E Haverhill St Unit 2
- 32 Josephine Ave
- 2 Leslie St
- 192 Union St
- 129-131 Lexington St
- 37 Albion St
- 68 Ashford St
- 89 Newbury St Unit 89B
- 80-82 Haverhill St
- 131A Lawrence St Unit 40
- 7-9 Bennington St
- 14 Buttonwood Dr
- 97 Kenwood Rd
Your Personal Tour Guide
Ask me questions while you tour the home.