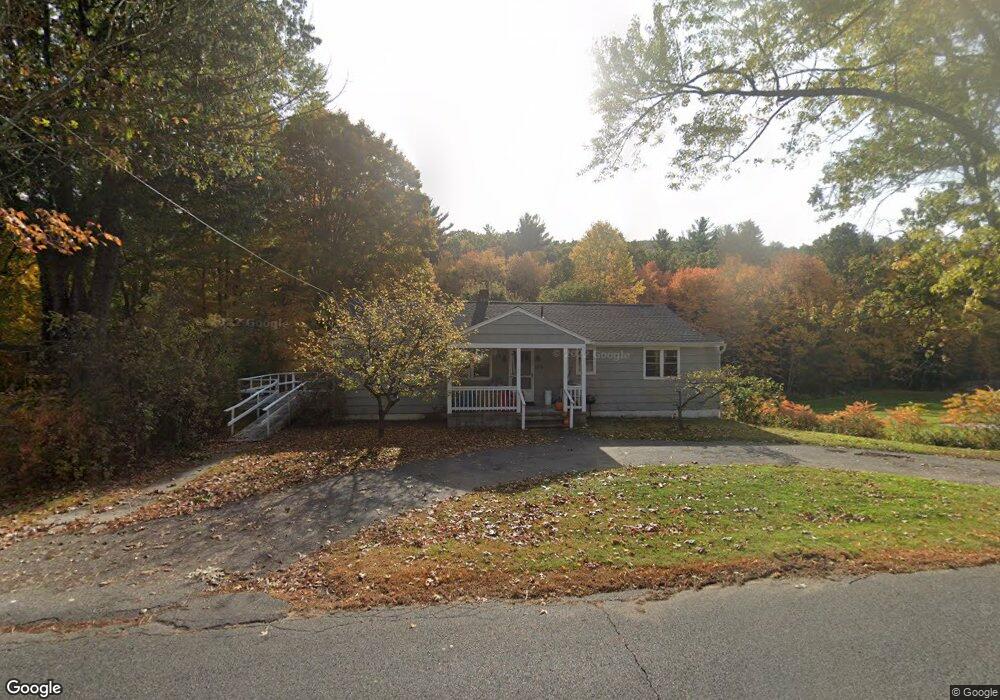
219 Hendrick St Easthampton, MA 01027
Estimated Value: $342,000 - $377,745
3
Beds
2
Baths
1,372
Sq Ft
$262/Sq Ft
Est. Value
About This Home
This home is located at 219 Hendrick St, Easthampton, MA 01027 and is currently estimated at $359,686, approximately $262 per square foot. 219 Hendrick St is a home located in Hampshire County with nearby schools including Easthampton High School, Tri-County Schools, and New England Adolescent Research Institute.
Ownership History
Date
Name
Owned For
Owner Type
Purchase Details
Closed on
May 24, 2002
Sold by
Heywood Laura L
Bought by
Dion Michael G
Current Estimated Value
Home Financials for this Owner
Home Financials are based on the most recent Mortgage that was taken out on this home.
Original Mortgage
$86,000
Interest Rate
7%
Purchase Details
Closed on
Feb 22, 1999
Sold by
Est Irmischer Robert D and Irmischer R Wade
Bought by
Dion Michael G and Heywood Laura L
Home Financials for this Owner
Home Financials are based on the most recent Mortgage that was taken out on this home.
Original Mortgage
$80,000
Interest Rate
6.75%
Mortgage Type
Purchase Money Mortgage
Create a Home Valuation Report for This Property
The Home Valuation Report is an in-depth analysis detailing your home's value as well as a comparison with similar homes in the area
Home Values in the Area
Average Home Value in this Area
Purchase History
| Date | Buyer | Sale Price | Title Company |
|---|---|---|---|
| Dion Michael G | $10,000 | -- | |
| Dion Michael G | $104,000 | -- |
Source: Public Records
Mortgage History
| Date | Status | Borrower | Loan Amount |
|---|---|---|---|
| Open | Dion Michael G | $100,000 | |
| Closed | Dion Michael G | $86,000 | |
| Previous Owner | Dion Michael G | $80,000 |
Source: Public Records
Tax History
| Year | Tax Paid | Tax Assessment Tax Assessment Total Assessment is a certain percentage of the fair market value that is determined by local assessors to be the total taxable value of land and additions on the property. | Land | Improvement |
|---|---|---|---|---|
| 2025 | $4,331 | $316,800 | $126,700 | $190,100 |
| 2024 | $4,178 | $308,100 | $122,900 | $185,200 |
| 2023 | $3,192 | $217,900 | $97,300 | $120,600 |
| 2022 | $3,602 | $217,900 | $97,300 | $120,600 |
| 2021 | $3,931 | $224,100 | $97,300 | $126,800 |
| 2020 | $3,870 | $217,900 | $97,300 | $120,600 |
| 2019 | $3,387 | $219,100 | $97,300 | $121,800 |
| 2018 | $3,245 | $202,800 | $91,700 | $111,100 |
| 2017 | $3,166 | $195,300 | $88,200 | $107,100 |
| 2016 | $3,045 | $195,300 | $88,200 | $107,100 |
| 2015 | $2,959 | $195,300 | $88,200 | $107,100 |
Source: Public Records
Map
Nearby Homes
Your Personal Tour Guide
Ask me questions while you tour the home.