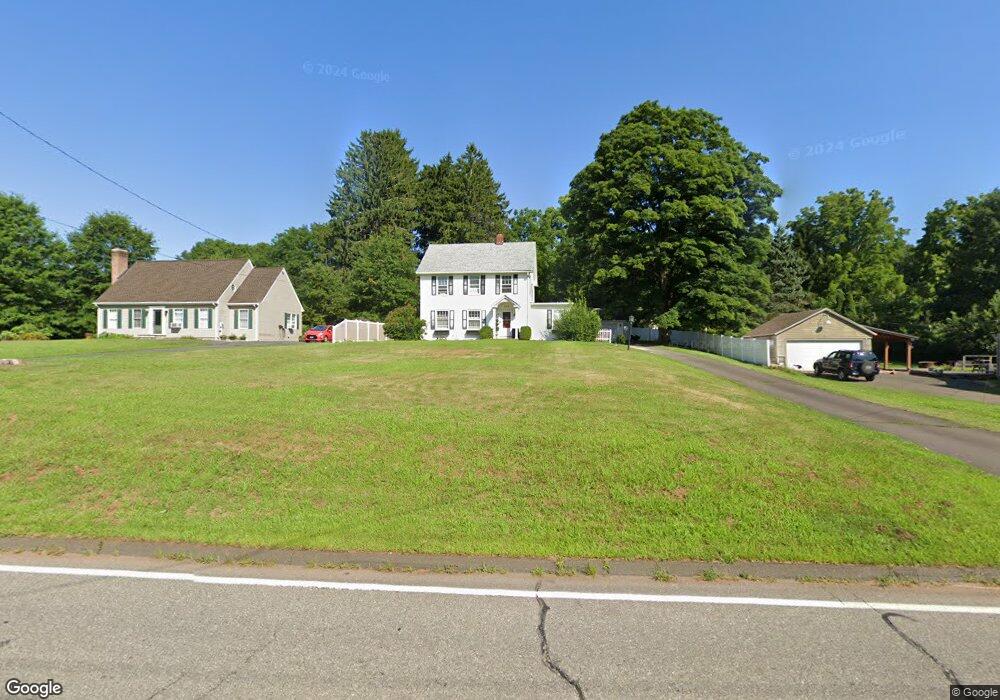
219 Main St Rockfall, CT 06481
Estimated Value: $397,245 - $466,000
3
Beds
2
Baths
1,757
Sq Ft
$250/Sq Ft
Est. Value
About This Home
This home is located at 219 Main St, Rockfall, CT 06481 and is currently estimated at $438,811, approximately $249 per square foot. 219 Main St is a home located in Middlesex County with nearby schools including Frank Ward Strong School, Coginchaug Regional High School, and The Independent Day School.
Ownership History
Date
Name
Owned For
Owner Type
Purchase Details
Closed on
Aug 15, 2003
Sold by
Staron Edward P
Bought by
Healy Timothy P and Sylvester Nina L
Current Estimated Value
Home Financials for this Owner
Home Financials are based on the most recent Mortgage that was taken out on this home.
Original Mortgage
$183,000
Interest Rate
5.46%
Mortgage Type
Purchase Money Mortgage
Purchase Details
Closed on
Sep 11, 1995
Sold by
Sayers Stephen F
Bought by
Staron Edward P
Create a Home Valuation Report for This Property
The Home Valuation Report is an in-depth analysis detailing your home's value as well as a comparison with similar homes in the area
Home Values in the Area
Average Home Value in this Area
Purchase History
| Date | Buyer | Sale Price | Title Company |
|---|---|---|---|
| Healy Timothy P | $258,000 | -- | |
| Staron Edward P | $137,000 | -- |
Source: Public Records
Mortgage History
| Date | Status | Borrower | Loan Amount |
|---|---|---|---|
| Open | Staron Edward P | $158,200 | |
| Closed | Staron Edward P | $183,000 | |
| Previous Owner | Staron Edward P | $57,600 | |
| Previous Owner | Staron Edward P | $69,000 |
Source: Public Records
Tax History
| Year | Tax Paid | Tax Assessment Tax Assessment Total Assessment is a certain percentage of the fair market value that is determined by local assessors to be the total taxable value of land and additions on the property. | Land | Improvement |
|---|---|---|---|---|
| 2025 | $5,930 | $199,000 | $74,000 | $125,000 |
| 2024 | $5,584 | $199,000 | $74,000 | $125,000 |
| 2023 | $5,620 | $199,000 | $74,000 | $125,000 |
| 2022 | $5,484 | $199,000 | $74,000 | $125,000 |
| 2021 | $5,018 | $157,700 | $69,000 | $88,700 |
| 2020 | $5,083 | $157,700 | $69,000 | $88,700 |
| 2019 | $5,121 | $157,700 | $69,000 | $88,700 |
| 2018 | $5,439 | $157,700 | $69,000 | $88,700 |
| 2017 | $5,773 | $157,700 | $69,000 | $88,700 |
| 2016 | $5,435 | $165,500 | $66,300 | $99,200 |
| 2015 | $5,572 | $165,500 | $66,300 | $99,200 |
| 2014 | $5,614 | $165,500 | $66,300 | $99,200 |
Source: Public Records
Map
Nearby Homes
- 107 Main St
- 169 Cedar St
- 30 Cherry Ridge Rd
- 17 Esther Dr
- 672 Laurel Grove Rd
- 1 Yellow Wood St
- 45 Dwight Rd
- 91 Gleeson Rd
- 0 Baileyville Rd
- 1271 Washington St Unit 4
- 5 Race Track Hollow
- 5 Lorraine Terrace
- 31 High St Unit Lot 2
- 31 High St Unit Lot 3
- 8 Blue Meadow Rd
- 15 Blue Spruce St
- 57 Edgewood Dr
- 3 Blue Bird Rd
- 6 Lakeview Place
- 56 Coles Rd
Your Personal Tour Guide
Ask me questions while you tour the home.