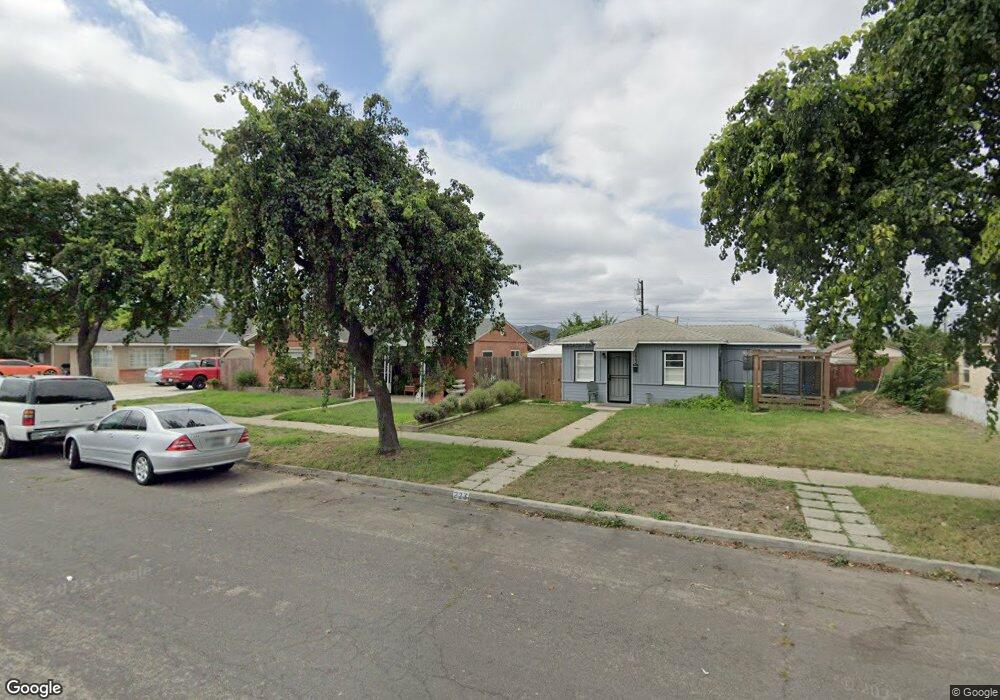
219 N C St Lompoc, CA 93436
Estimated Value: $539,000 - $615,000
2
Beds
2
Baths
1,980
Sq Ft
$299/Sq Ft
Est. Value
About This Home
This home is located at 219 N C St, Lompoc, CA 93436 and is currently estimated at $591,570, approximately $298 per square foot. 219 N C St is a home located in Santa Barbara County with nearby schools including Arthur Hapgood Elementary School, Lompoc Valley Middle School, and Lompoc High School.
Ownership History
Date
Name
Owned For
Owner Type
Purchase Details
Closed on
May 21, 2021
Sold by
Ray Laura E
Bought by
Orozco Jose Antonio Chavez and Ramirez Angelica Garcia
Current Estimated Value
Purchase Details
Closed on
May 28, 2019
Sold by
The Gregory S Laura E Ray Trusty
Bought by
Ray Laura E
Purchase Details
Closed on
Jun 15, 2001
Sold by
Gregory S & Laura E Ray Trust
Bought by
Ray Gregory S and Ray Laura E
Home Financials for this Owner
Home Financials are based on the most recent Mortgage that was taken out on this home.
Original Mortgage
$150,312
Interest Rate
7.15%
Mortgage Type
Stand Alone First
Purchase Details
Closed on
May 17, 2000
Sold by
Ray M Lee Liv Tr 4-20-93 and Gregory S
Bought by
Gregory S & Laura E Ray Trust
Create a Home Valuation Report for This Property
The Home Valuation Report is an in-depth analysis detailing your home's value as well as a comparison with similar homes in the area
Home Values in the Area
Average Home Value in this Area
Purchase History
| Date | Buyer | Sale Price | Title Company |
|---|---|---|---|
| Orozco Jose Antonio Chavez | $149,000 | Fidelity National Title Co | |
| Ray Laura E | -- | First American Title | |
| Ray Gregory S | -- | Chicago Title Co | |
| Gregory S & Laura E Ray Trust | -- | -- |
Source: Public Records
Mortgage History
| Date | Status | Borrower | Loan Amount |
|---|---|---|---|
| Previous Owner | Ray Gregory S | $150,312 |
Source: Public Records
Tax History
| Year | Tax Paid | Tax Assessment Tax Assessment Total Assessment is a certain percentage of the fair market value that is determined by local assessors to be the total taxable value of land and additions on the property. | Land | Improvement |
|---|---|---|---|---|
| 2025 | $4,627 | $424,483 | $137,957 | $286,526 |
| 2023 | $4,627 | $408,000 | $132,600 | $275,400 |
| 2022 | $4,547 | $400,000 | $130,000 | $270,000 |
| 2021 | $1,239 | $102,759 | $13,906 | $88,853 |
| 2020 | $1,227 | $101,706 | $13,764 | $87,942 |
| 2019 | $1,206 | $99,713 | $13,495 | $86,218 |
| 2018 | $1,187 | $97,759 | $13,231 | $84,528 |
| 2017 | $1,166 | $95,926 | $12,977 | $82,949 |
| 2016 | $1,145 | $94,046 | $12,723 | $81,323 |
| 2014 | $1,120 | $90,820 | $12,287 | $78,533 |
Source: Public Records
Map
Nearby Homes
- 113 N B St
- 801, 851 California 246
- 205 S E St
- 240 Quail Cir
- 109 S 3rd St
- 321 N Third St
- 319 S B St
- 505 N 1st St
- 117 S I St
- 215 S H St
- 1204 E Walnut Ave Unit B
- 533 N G St
- 622 N B St
- 1200 Peach Ave
- 510 N I St
- 610 E Pine Ave Unit 10
- 610 E Pine Ave Unit 29
- 610 E Pine Ave Unit 62
- 1416 E Walnut Ave
- 1105 E Olive Ave
Your Personal Tour Guide
Ask me questions while you tour the home.