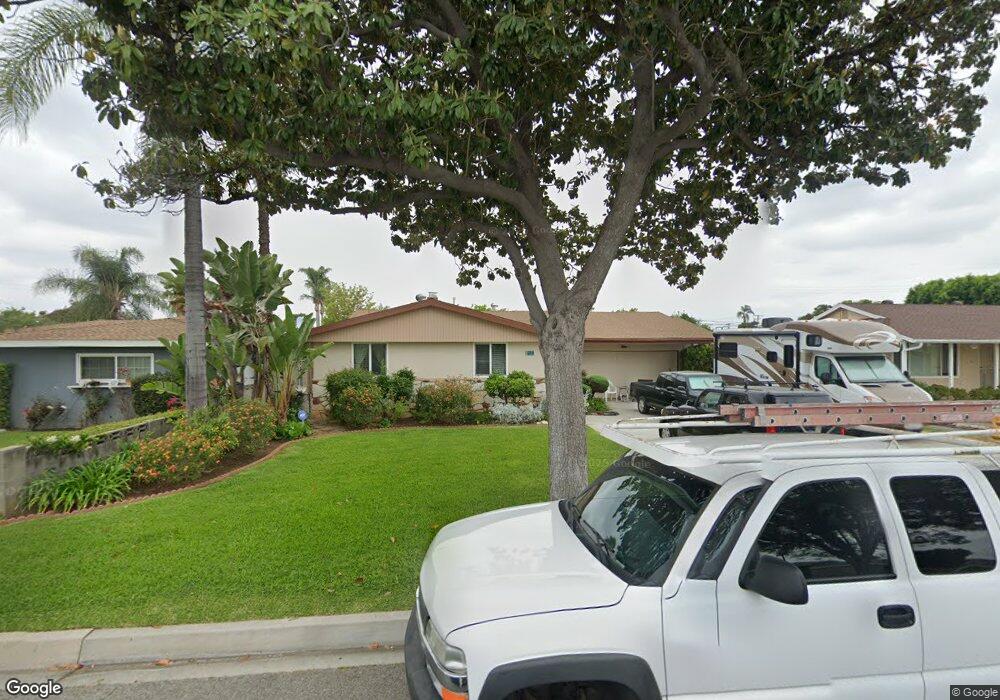
219 N Morada Ave West Covina, CA 91790
Estimated Value: $800,000 - $928,000
4
Beds
3
Baths
1,758
Sq Ft
$486/Sq Ft
Est. Value
About This Home
This home is located at 219 N Morada Ave, West Covina, CA 91790 and is currently estimated at $854,624, approximately $486 per square foot. 219 N Morada Ave is a home located in Los Angeles County with nearby schools including Rowland Avenue Elementary School, Traweek Middle School, and Covina High School.
Ownership History
Date
Name
Owned For
Owner Type
Purchase Details
Closed on
Nov 24, 2020
Sold by
Garcia Gloria E and The Gloria E Garcia Revocable
Bought by
Garcia Gloria E and The Gloria E Garcia Revocable
Current Estimated Value
Home Financials for this Owner
Home Financials are based on the most recent Mortgage that was taken out on this home.
Original Mortgage
$290,000
Outstanding Balance
$258,647
Interest Rate
2.8%
Mortgage Type
New Conventional
Estimated Equity
$595,977
Purchase Details
Closed on
Jan 30, 2013
Sold by
Garcia Gloria E
Bought by
The Gloria E Garcia Revocable 2013 Trust
Purchase Details
Closed on
Mar 14, 2007
Sold by
Garcia Joe B
Bought by
Garcia Gloria E
Home Financials for this Owner
Home Financials are based on the most recent Mortgage that was taken out on this home.
Original Mortgage
$155,000
Interest Rate
6.31%
Mortgage Type
New Conventional
Purchase Details
Closed on
Sep 13, 1996
Sold by
Va
Bought by
Garcia Joe B
Create a Home Valuation Report for This Property
The Home Valuation Report is an in-depth analysis detailing your home's value as well as a comparison with similar homes in the area
Home Values in the Area
Average Home Value in this Area
Purchase History
| Date | Buyer | Sale Price | Title Company |
|---|---|---|---|
| Garcia Gloria E | -- | Wfg National Title Co Of Ca | |
| The Gloria E Garcia Revocable 2013 Trust | -- | None Available | |
| Garcia Gloria E | -- | New Century Title Company | |
| Garcia Joe B | -- | -- |
Source: Public Records
Mortgage History
| Date | Status | Borrower | Loan Amount |
|---|---|---|---|
| Open | Garcia Gloria E | $290,000 | |
| Closed | Garcia Gloria E | $155,000 |
Source: Public Records
Tax History Compared to Growth
Tax History
| Year | Tax Paid | Tax Assessment Tax Assessment Total Assessment is a certain percentage of the fair market value that is determined by local assessors to be the total taxable value of land and additions on the property. | Land | Improvement |
|---|---|---|---|---|
| 2025 | $1,955 | $123,363 | $35,758 | $87,605 |
| 2024 | $1,955 | $120,945 | $35,057 | $85,888 |
| 2023 | $1,926 | $118,574 | $34,370 | $84,204 |
| 2022 | $1,899 | $116,250 | $33,697 | $82,553 |
| 2021 | $1,862 | $113,972 | $33,037 | $80,935 |
| 2020 | $1,836 | $112,805 | $32,699 | $80,106 |
| 2019 | $1,813 | $110,594 | $32,058 | $78,536 |
| 2018 | $1,648 | $108,427 | $31,430 | $76,997 |
| 2016 | $1,523 | $104,218 | $30,210 | $74,008 |
| 2015 | $1,495 | $102,654 | $29,757 | $72,897 |
| 2014 | $1,485 | $100,645 | $29,175 | $71,470 |
Source: Public Records
Map
Nearby Homes
- 218 Lockhart Way
- 120 Poxon Place
- 1005 W Greendale St
- 427 N Walnuthaven Dr
- 410 N Lyall Ave
- 557 N Broadmoor Ave
- 154 N Roberto Ave
- 1327 E Thelborn St
- 1553 Dennis Place
- 1401 E Garvey Ave S
- 1037 E Grovecenter St
- 912 W Service Ave
- 434 N Orange Ave
- 1814 Seattle St
- 1626 Cayton Loop
- 1908 W Thelborn St
- 509 Tamarind Way Unit B
- 1736 Cayton Loop
- 1536 E Norma Ave
- 1752 Cayton Loop
- 213 N Morada Ave
- 223 N Morada Ave
- 207 N Morada Ave
- 227 N Morada Ave
- 220 N Hartley St
- 224 N Hartley St
- 214 N Hartley St
- 228 N Hartley St
- 208 N Hartley St
- 203 N Morada Ave
- 233 N Morada Ave
- 220 N Morada Ave
- 214 N Morada Ave
- 224 N Morada Ave
- 234 N Hartley St
- 208 N Morada Ave
- 204 N Hartley St
- 228 N Morada Ave
- 239 N Morada Ave
- 147 N Morada Ave