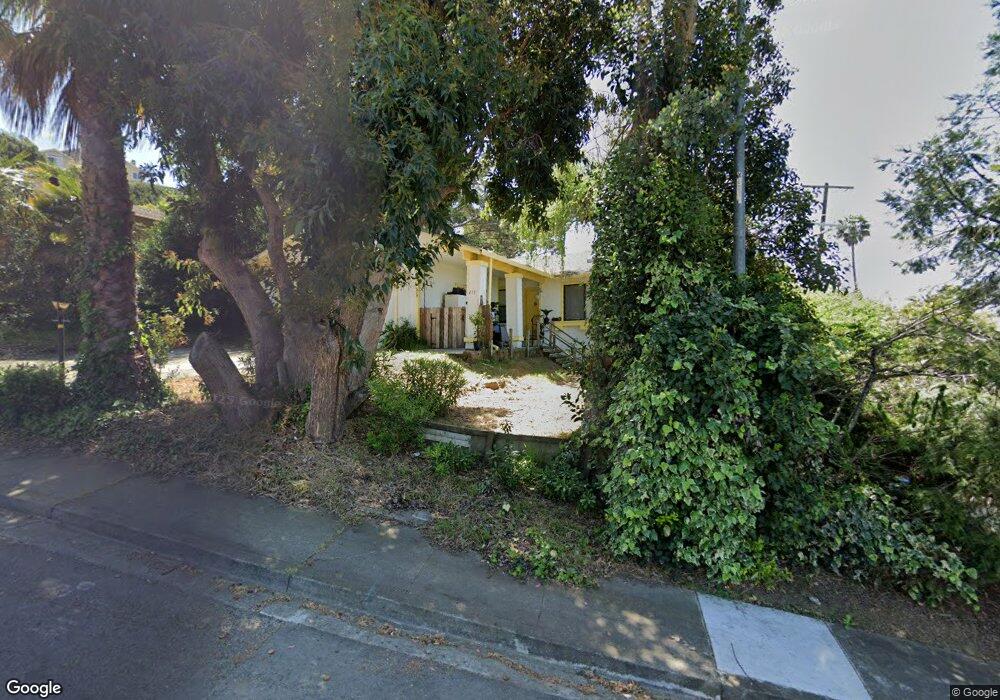
219 Pueblo Way Vallejo, CA 94591
South Vallejo NeighborhoodEstimated Value: $452,000 - $539,000
4
Beds
2
Baths
1,393
Sq Ft
$348/Sq Ft
Est. Value
About This Home
This home is located at 219 Pueblo Way, Vallejo, CA 94591 and is currently estimated at $484,814, approximately $348 per square foot. 219 Pueblo Way is a home located in Solano County with nearby schools including Glen Cove Elementary, Jesse M. Bethel High School, and St. Patrick-St. Vincent High School.
Ownership History
Date
Name
Owned For
Owner Type
Purchase Details
Closed on
Dec 16, 1998
Sold by
Benicia Cato Mixon
Bought by
Belic Roko
Current Estimated Value
Home Financials for this Owner
Home Financials are based on the most recent Mortgage that was taken out on this home.
Original Mortgage
$107,200
Outstanding Balance
$24,098
Interest Rate
6.66%
Mortgage Type
Stand Alone First
Estimated Equity
$460,716
Purchase Details
Closed on
Sep 2, 1993
Sold by
Walker Blanche
Bought by
Cato Mixon Benicia
Create a Home Valuation Report for This Property
The Home Valuation Report is an in-depth analysis detailing your home's value as well as a comparison with similar homes in the area
Home Values in the Area
Average Home Value in this Area
Purchase History
| Date | Buyer | Sale Price | Title Company |
|---|---|---|---|
| Belic Roko | $134,000 | North American Title Co | |
| Cato Mixon Benicia | $30,000 | -- |
Source: Public Records
Mortgage History
| Date | Status | Borrower | Loan Amount |
|---|---|---|---|
| Open | Belic Roko | $107,200 |
Source: Public Records
Tax History Compared to Growth
Tax History
| Year | Tax Paid | Tax Assessment Tax Assessment Total Assessment is a certain percentage of the fair market value that is determined by local assessors to be the total taxable value of land and additions on the property. | Land | Improvement |
|---|---|---|---|---|
| 2025 | $3,473 | $210,062 | $47,024 | $163,038 |
| 2024 | $3,473 | $205,944 | $46,102 | $159,842 |
| 2023 | $3,251 | $201,907 | $45,199 | $156,708 |
| 2022 | $3,149 | $197,949 | $44,313 | $153,636 |
| 2021 | $3,079 | $194,069 | $43,445 | $150,624 |
| 2020 | $3,082 | $192,080 | $43,000 | $149,080 |
| 2019 | $2,979 | $188,314 | $42,157 | $146,157 |
| 2018 | $2,782 | $184,623 | $41,331 | $143,292 |
| 2017 | $2,636 | $181,004 | $40,521 | $140,483 |
| 2016 | $2,066 | $177,456 | $39,727 | $137,729 |
| 2015 | $2,039 | $174,792 | $39,131 | $135,661 |
| 2014 | $2,011 | $171,369 | $38,365 | $133,004 |
Source: Public Records
Map
Nearby Homes
- 173 Jordan St
- 227 Clearpointe Dr
- 126 Jordan St
- 247 Clearpointe Dr
- 2 Jordan St
- 118 Outrigger Dr
- 15 Constance Dr
- 175 Frieda Cir
- 1401 Magazine St
- 154 Outrigger Dr
- 87 Gloria Ct
- 1406 Magazine St
- 121 La Brea St
- 199 Sandy Beach Rd
- 103 Kay Dr
- 219 Sea Crest Cir
- 65 Beverly Dr
- 143 Sea Crest Cir
- 201 Sandy Beach Rd
- 954 Grant St