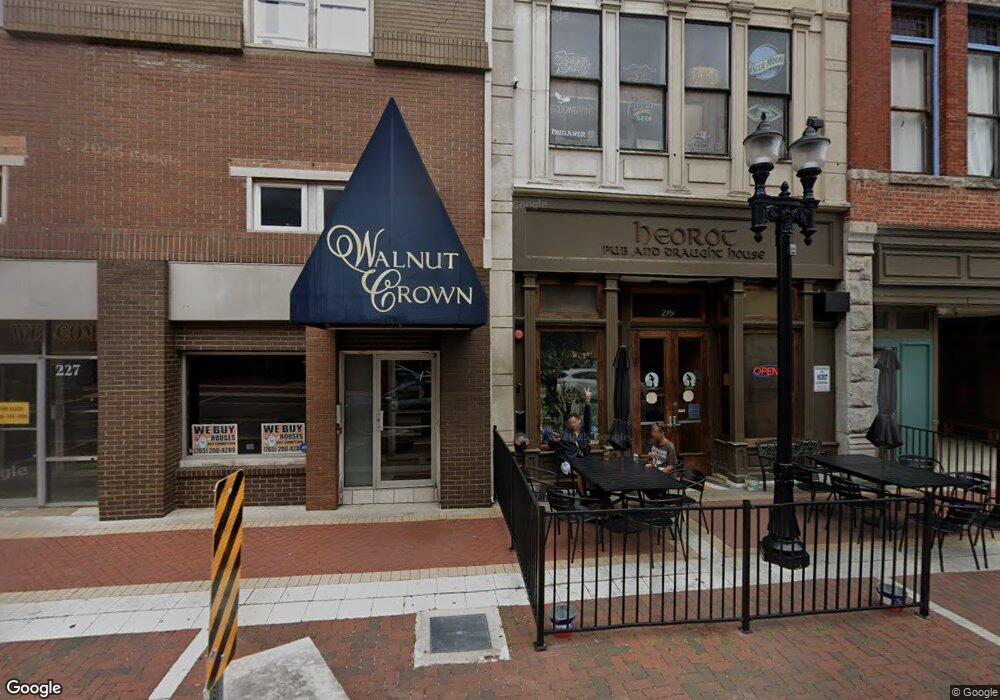
219 S Walnut St Muncie, IN 47305
Downtown Muncie NeighborhoodEstimated Value: $273,843
--
Bed
--
Bath
6,600
Sq Ft
$41/Sq Ft
Est. Value
About This Home
This home is located at 219 S Walnut St, Muncie, IN 47305 and is currently estimated at $273,843, approximately $41 per square foot. 219 S Walnut St is a home located in Delaware County with nearby schools including Muncie Central High School, South View Elementary School, and Northside Middle School.
Ownership History
Date
Name
Owned For
Owner Type
Purchase Details
Closed on
Apr 15, 2022
Sold by
Stephens and Jeanette
Bought by
Kerr And Phillips Properties Llc
Current Estimated Value
Home Financials for this Owner
Home Financials are based on the most recent Mortgage that was taken out on this home.
Original Mortgage
$157,500
Outstanding Balance
$53,186
Interest Rate
3.85%
Mortgage Type
Credit Line Revolving
Estimated Equity
$220,657
Create a Home Valuation Report for This Property
The Home Valuation Report is an in-depth analysis detailing your home's value as well as a comparison with similar homes in the area
Home Values in the Area
Average Home Value in this Area
Purchase History
| Date | Buyer | Sale Price | Title Company |
|---|---|---|---|
| Kerr And Phillips Properties Llc | $225,000 | Trulock James W |
Source: Public Records
Mortgage History
| Date | Status | Borrower | Loan Amount |
|---|---|---|---|
| Open | Kerr And Phillips Properties Llc | $157,500 |
Source: Public Records
Tax History Compared to Growth
Tax History
| Year | Tax Paid | Tax Assessment Tax Assessment Total Assessment is a certain percentage of the fair market value that is determined by local assessors to be the total taxable value of land and additions on the property. | Land | Improvement |
|---|---|---|---|---|
| 2024 | $5,448 | $178,000 | $31,000 | $147,000 |
| 2023 | $5,448 | $178,000 | $31,000 | $147,000 |
| 2022 | $3,948 | $128,000 | $31,000 | $97,000 |
| 2021 | $3,741 | $121,100 | $31,000 | $90,100 |
| 2020 | $3,741 | $121,100 | $31,000 | $90,100 |
| 2019 | $3,291 | $106,100 | $31,000 | $75,100 |
| 2018 | $3,291 | $106,100 | $31,000 | $75,100 |
| 2017 | $3,222 | $103,800 | $31,000 | $72,800 |
| 2016 | $3,222 | $135,200 | $31,000 | $104,200 |
| 2014 | $3,103 | $101,400 | $31,000 | $70,400 |
| 2013 | -- | $100,600 | $31,000 | $69,600 |
Source: Public Records
Map
Nearby Homes
- 114 S Walnut St
- 114 S Walnut St Unit 100 & 200
- 407 W Adams St
- 411 - 413 W Adams St
- 429 W Charles St
- 415 W Howard St
- 27 W Orchard Place
- 312 S Gharkey St
- 616 E Charles St
- 502 S Mound St
- 216 N Vine St
- 820 W Howard St
- 303 S Proud St
- 305 S Proud St
- 709 S Vine St
- 320 N Vine St
- 925 W Powers St
- 304 N Hackley St
- 1008 W 1st St
- 709 N Wheeling Ave
- 211 S Walnut St
- 301 S Walnut #202 St
- 301 S Walnut St Unit 202
- 301 S Walnut St
- 301 S Walnut St
- 301 S Walnut St Unit 308
- 301 S Walnut St Unit 306
- 301 S Walnut St Unit 207
- 301 S Walnut St
- 301 S Walnut St Unit 301
- 301 S Walnut St Unit 207
- 301 S Walnut St
- 301 S Walnut St Unit The Lofts @ Mitchell
- 301 S Walnut St
- 301 S Walnut St
- 301 S Walnut St
- 301 S Walnut St
- 301 S Walnut St Unit 305
- 301 S Walnut St Unit 204
- 301 S Walnut St Unit 206