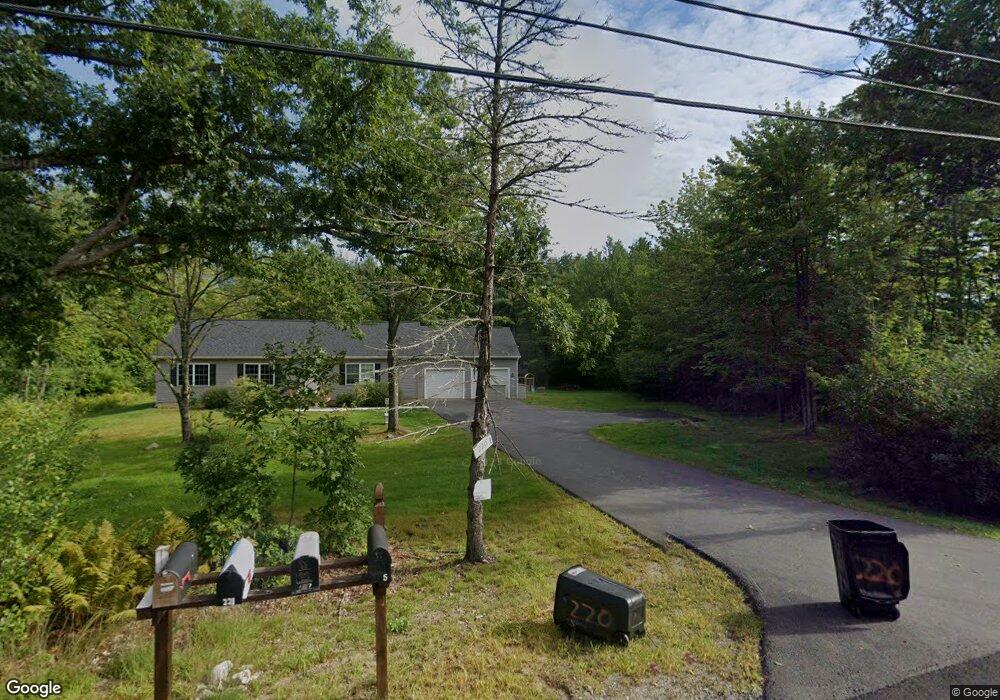
219 Shaker Rd Unit 2 Northfield, NH 03276
Estimated Value: $455,000 - $501,000
1
Bed
1
Bath
1,475
Sq Ft
$321/Sq Ft
Est. Value
About This Home
This home is located at 219 Shaker Rd Unit 2, Northfield, NH 03276 and is currently estimated at $473,611, approximately $321 per square foot. 219 Shaker Rd Unit 2 is a home located in Merrimack County with nearby schools including Union Sanborn School, Sanbornton Central School, and Winnisquam Regional Middle School.
Ownership History
Date
Name
Owned For
Owner Type
Purchase Details
Closed on
Jan 20, 2023
Sold by
4G Properties Llc
Bought by
Champney Graton D
Current Estimated Value
Home Financials for this Owner
Home Financials are based on the most recent Mortgage that was taken out on this home.
Original Mortgage
$380,000
Outstanding Balance
$367,659
Interest Rate
6.33%
Mortgage Type
Purchase Money Mortgage
Estimated Equity
$105,952
Purchase Details
Closed on
Aug 19, 2022
Sold by
Talamantez Bonnie
Bought by
4G Properties Llc
Purchase Details
Closed on
Aug 27, 2021
Sold by
Northfield Town Of
Bought by
Talamantez Bonnie M
Create a Home Valuation Report for This Property
The Home Valuation Report is an in-depth analysis detailing your home's value as well as a comparison with similar homes in the area
Home Values in the Area
Average Home Value in this Area
Purchase History
| Date | Buyer | Sale Price | Title Company |
|---|---|---|---|
| Champney Graton D | $380,000 | None Available | |
| 4G Properties Llc | -- | None Available | |
| Talamantez Bonnie M | -- | None Available |
Source: Public Records
Mortgage History
| Date | Status | Borrower | Loan Amount |
|---|---|---|---|
| Open | Champney Graton D | $380,000 |
Source: Public Records
Tax History Compared to Growth
Tax History
| Year | Tax Paid | Tax Assessment Tax Assessment Total Assessment is a certain percentage of the fair market value that is determined by local assessors to be the total taxable value of land and additions on the property. | Land | Improvement |
|---|---|---|---|---|
| 2024 | $5,022 | $340,000 | $135,200 | $204,800 |
| 2023 | $4,777 | $340,000 | $135,200 | $204,800 |
| 2022 | $4,657 | $320,100 | $131,400 | $188,700 |
| 2021 | $0 | $176,300 | $68,600 | $107,700 |
| 2020 | $4,014 | $176,300 | $68,600 | $107,700 |
| 2019 | $4,196 | $176,300 | $68,600 | $107,700 |
| 2018 | $4,311 | $176,300 | $68,600 | $107,700 |
| 2017 | $4,266 | $176,300 | $68,600 | $107,700 |
| 2016 | $3,858 | $148,500 | $47,500 | $101,000 |
| 2015 | $3,735 | $149,300 | $47,500 | $101,800 |
| 2014 | $3,813 | $148,900 | $47,500 | $101,400 |
| 2012 | $4,021 | $143,600 | $47,500 | $96,100 |
Source: Public Records
Map
Nearby Homes