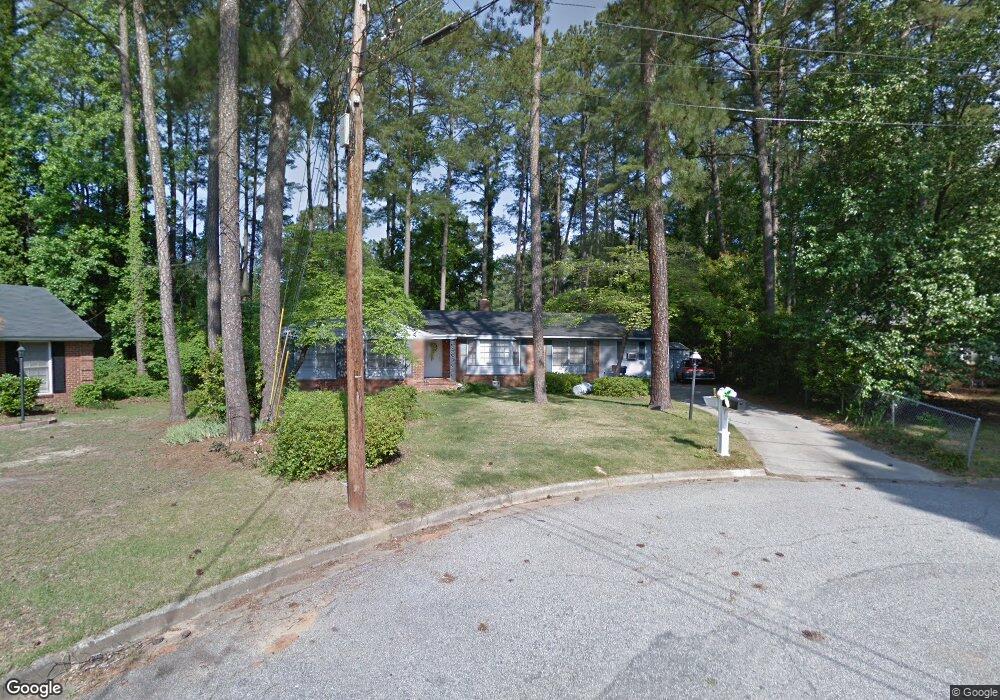
219 Simmons Ct Augusta, GA 30907
Montclair NeighborhoodEstimated Value: $298,331 - $361,000
4
Beds
3
Baths
2,349
Sq Ft
$142/Sq Ft
Est. Value
About This Home
This home is located at 219 Simmons Ct, Augusta, GA 30907 and is currently estimated at $333,833, approximately $142 per square foot. 219 Simmons Ct is a home located in Richmond County with nearby schools including Warren Road Elementary School, Tutt Middle School, and Johnson Magnet.
Ownership History
Date
Name
Owned For
Owner Type
Purchase Details
Closed on
Jan 29, 2007
Sold by
Oneal Floyd
Bought by
Oneal Kelly J
Current Estimated Value
Home Financials for this Owner
Home Financials are based on the most recent Mortgage that was taken out on this home.
Original Mortgage
$139,867
Outstanding Balance
$81,649
Interest Rate
6.07%
Mortgage Type
Purchase Money Mortgage
Estimated Equity
$252,184
Purchase Details
Closed on
Dec 27, 2005
Sold by
Alger Robert E and Alger Alice M
Bought by
Oneal Kelly J and Oneal Floyd
Home Financials for this Owner
Home Financials are based on the most recent Mortgage that was taken out on this home.
Original Mortgage
$128,250
Interest Rate
7.12%
Mortgage Type
Fannie Mae Freddie Mac
Purchase Details
Closed on
Sep 1, 1986
Sold by
Nosek Thomas M By A
Bought by
Alger Robert E
Purchase Details
Closed on
Jun 1, 1976
Create a Home Valuation Report for This Property
The Home Valuation Report is an in-depth analysis detailing your home's value as well as a comparison with similar homes in the area
Home Values in the Area
Average Home Value in this Area
Purchase History
| Date | Buyer | Sale Price | Title Company |
|---|---|---|---|
| Oneal Kelly J | -- | None Available | |
| Oneal Kelly J | $135,000 | None Available | |
| O'Neal Kelly J | $135,000 | -- | |
| Alger Robert E | $89,900 | -- | |
| -- | $40,000 | -- |
Source: Public Records
Mortgage History
| Date | Status | Borrower | Loan Amount |
|---|---|---|---|
| Open | Oneal Kelly J | $139,867 | |
| Previous Owner | O'Neal Kelly J | $128,250 |
Source: Public Records
Tax History
| Year | Tax Paid | Tax Assessment Tax Assessment Total Assessment is a certain percentage of the fair market value that is determined by local assessors to be the total taxable value of land and additions on the property. | Land | Improvement |
|---|---|---|---|---|
| 2025 | $3,712 | $127,512 | $13,200 | $114,312 |
| 2024 | $3,712 | $117,712 | $13,200 | $104,512 |
| 2023 | $2,264 | $100,324 | $13,200 | $87,124 |
| 2022 | $2,372 | $78,614 | $13,200 | $65,414 |
| 2021 | $2,421 | $73,682 | $13,200 | $60,482 |
| 2020 | $2,381 | $73,682 | $13,200 | $60,482 |
| 2019 | $2,241 | $64,653 | $11,600 | $53,053 |
| 2018 | $2,257 | $64,653 | $11,600 | $53,053 |
| 2017 | $2,246 | $64,653 | $11,600 | $53,053 |
| 2016 | $2,247 | $64,653 | $11,600 | $53,053 |
| 2015 | $2,263 | $64,653 | $11,600 | $53,053 |
| 2014 | $2,266 | $64,653 | $11,600 | $53,053 |
Source: Public Records
Map
Nearby Homes
- 221 Simmons Ct
- 225 Simmons Ct
- 151 Avondale Ct
- 213 Kings Chapel Rd
- 3319 Thread Needle Rd W
- 3145 Crane Ferry Rd
- 3223 Crane Ferry Rd
- 203 Buckhead Ct
- 150 Gardners Mill Rd
- 385 Folkstone Cir
- 333 Indian Trail
- 306 Pleasant Home Rd
- 115 Clark St
- 3103 Clay Hill Dr
- 429 Shallowford Cir
- 427 Shallowford Cir
- 3315 Sugar Mill Rd
- 2319 Creek View Dr
- 306 Skylark Rd
- 3310 Sandpiper Ln
- 217 Simmons Ct
- 214 Thread Needle Rd W
- 212 Thread Needle Rd E
- 207 Old Church Ct
- 215 Simmons Ct
- 216 Thread Needle Rd E
- 223 Simmons Ct
- 210 Thread Needle Rd W
- 214E Thread Needle Rd E
- 210 Thread Needle Rd E
- 207 Old Church Rd
- 205 Old Church Ct
- 218 Thread Needle Rd E
- 213 Simmons Ct
- 206 Old Church Ct
- 208 Thread Needle Rd E
- 311 Gardners Mill Ct
- 313 Gardners Mill Ct
- 213E Thread Needle Rd E
- 211E Thread Needle Rd E
Your Personal Tour Guide
Ask me questions while you tour the home.