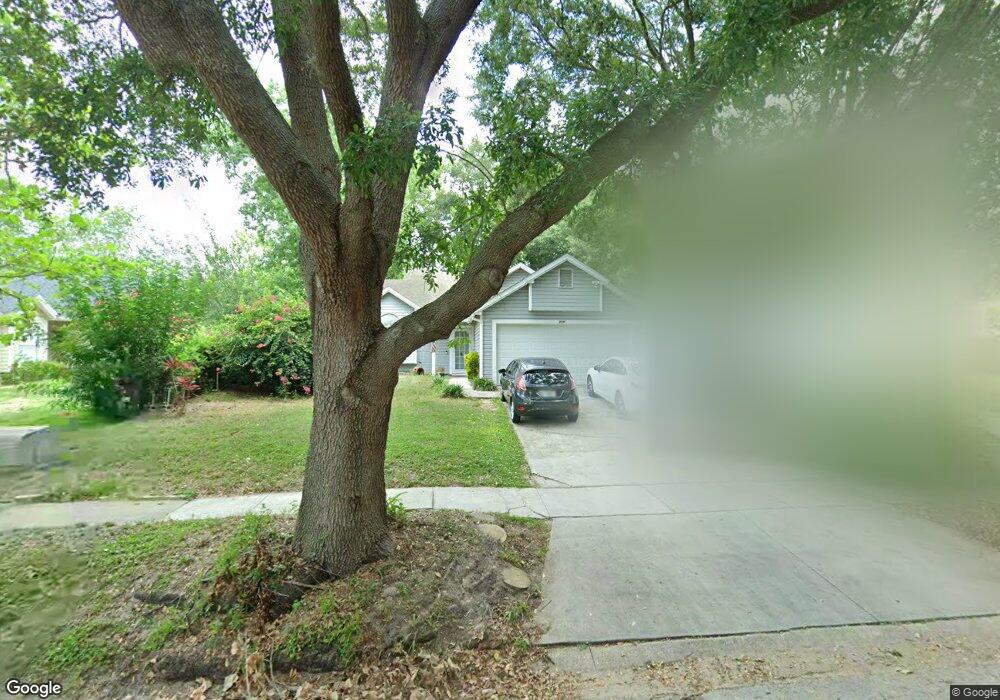
219 Sonoma Valley Cir Orlando, FL 32835
MetroWest NeighborhoodEstimated Value: $323,000 - $355,000
3
Beds
2
Baths
1,182
Sq Ft
$286/Sq Ft
Est. Value
About This Home
This home is located at 219 Sonoma Valley Cir, Orlando, FL 32835 and is currently estimated at $337,651, approximately $285 per square foot. 219 Sonoma Valley Cir is a home located in Orange County with nearby schools including Oak Hill Elementary, Gotha Middle School, and Olympia High.
Ownership History
Date
Name
Owned For
Owner Type
Purchase Details
Closed on
Oct 30, 2015
Sold by
Greene Rachel and Greene Shawn D
Bought by
Cook Jacqueline M
Current Estimated Value
Home Financials for this Owner
Home Financials are based on the most recent Mortgage that was taken out on this home.
Original Mortgage
$157,102
Outstanding Balance
$122,850
Interest Rate
3.62%
Mortgage Type
FHA
Estimated Equity
$214,801
Purchase Details
Closed on
May 26, 2000
Sold by
Jones Rhonda L
Bought by
Greene Shawn D and Greene Rachel
Home Financials for this Owner
Home Financials are based on the most recent Mortgage that was taken out on this home.
Original Mortgage
$100,920
Interest Rate
8.14%
Mortgage Type
FHA
Purchase Details
Closed on
May 20, 1994
Sold by
Farrier Robert O and Farrier Angela
Bought by
Jones Rhonda
Home Financials for this Owner
Home Financials are based on the most recent Mortgage that was taken out on this home.
Original Mortgage
$75,256
Interest Rate
8.48%
Mortgage Type
FHA
Create a Home Valuation Report for This Property
The Home Valuation Report is an in-depth analysis detailing your home's value as well as a comparison with similar homes in the area
Home Values in the Area
Average Home Value in this Area
Purchase History
| Date | Buyer | Sale Price | Title Company |
|---|---|---|---|
| Cook Jacqueline M | $160,000 | North American Title Company | |
| Greene Shawn D | $101,000 | -- | |
| Jones Rhonda | $75,000 | -- |
Source: Public Records
Mortgage History
| Date | Status | Borrower | Loan Amount |
|---|---|---|---|
| Open | Cook Jacqueline M | $157,102 | |
| Previous Owner | Greene Shawn D | $102,576 | |
| Previous Owner | Greene Shawn D | $100,920 | |
| Previous Owner | Jones Rhonda | $75,256 |
Source: Public Records
Tax History Compared to Growth
Tax History
| Year | Tax Paid | Tax Assessment Tax Assessment Total Assessment is a certain percentage of the fair market value that is determined by local assessors to be the total taxable value of land and additions on the property. | Land | Improvement |
|---|---|---|---|---|
| 2025 | $2,259 | $160,711 | -- | -- |
| 2024 | $2,114 | $156,182 | -- | -- |
| 2023 | $2,114 | $147,359 | $0 | $0 |
| 2022 | $2,011 | $143,067 | $0 | $0 |
| 2021 | $1,969 | $138,900 | $0 | $0 |
| 2020 | $1,864 | $136,982 | $0 | $0 |
| 2019 | $1,906 | $133,902 | $0 | $0 |
| 2018 | $1,877 | $131,405 | $0 | $0 |
| 2017 | $1,836 | $136,114 | $44,000 | $92,114 |
| 2016 | $1,807 | $126,055 | $40,000 | $86,055 |
| 2015 | $1,254 | $120,986 | $40,000 | $80,986 |
| 2014 | $1,287 | $91,210 | $30,000 | $61,210 |
Source: Public Records
Map
Nearby Homes
- 249 Sonoma Valley Cir
- 7632 Pacific Heights Cir
- 7319 Seamans Bluff
- 7266 Oak Meadows Cir
- 7724 Pengrove Pass
- 7237 Harbor Heights Cir
- 20 Winter Ridge Cir
- 7717 Pineapple Dr
- 7606 Brisbane Ct
- 7748 Pengrove Pass
- 1044 Nin St
- 252 Alston Dr Unit II
- 232 Sandpiper Ridge Dr
- 341 Alston Dr
- 7003 Harbor Point Blvd
- 989 Summer Lakes Dr
- 119 Killington Way
- 352 Ashbourne Dr
- 307 S Hiawassee Rd
- 230 Lucile Way
- 221 Sonoma Valley Cir
- 213 Sonoma Valley Cir
- 211 Sonoma Valley Cir
- 114 Pier Point Ct Unit 2
- 114 Pier Point Ct
- 112 Pier Point Ct
- 108 Pier Point Ct
- 207 Sonoma Valley Cir
- 220 Sonoma Valley Cir
- 106 Pier Point Ct
- 224 Sonoma Valley Cir
- 218 Sonoma Valley Cir
- 205 Sonoma Valley Cir Unit 2
- 205 Sonoma Valley Cir
- 102 Pier Point Ct
- 226 Sonoma Valley Cir
- 208 Sonoma Valley Cir
- 230 Sonoma Valley Cir
- 115 Pier Point Ct
- 113 Pier Point Ct Unit 2