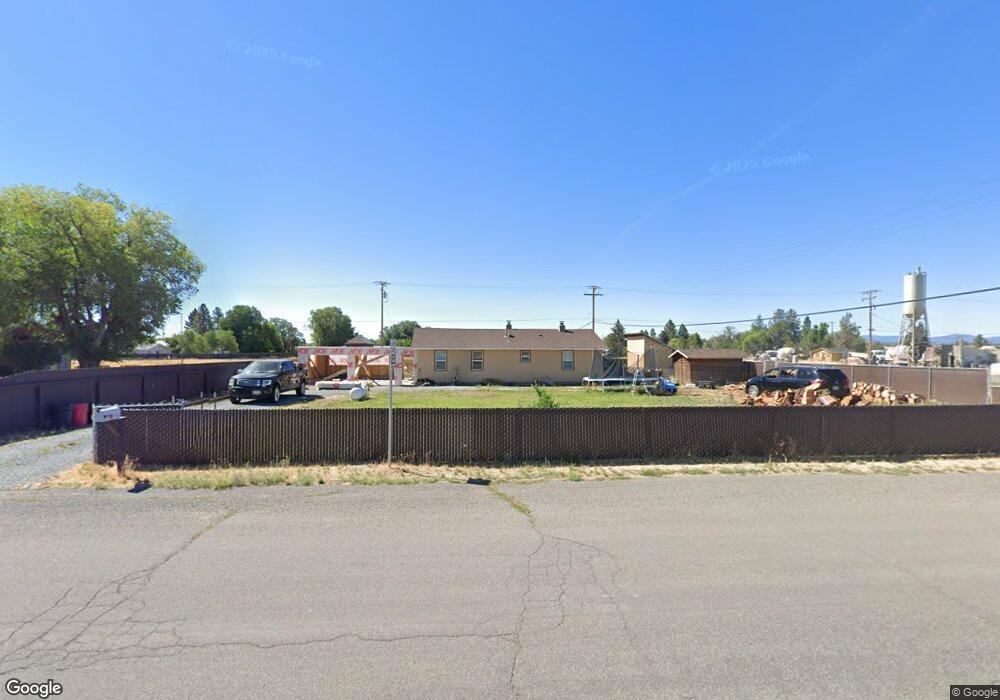
219 W 16th St Alturas, CA 96101
Estimated Value: $125,000 - $190,000
3
Beds
1
Bath
1,144
Sq Ft
$137/Sq Ft
Est. Value
About This Home
This home is located at 219 W 16th St, Alturas, CA 96101 and is currently estimated at $156,309, approximately $136 per square foot. 219 W 16th St is a home with nearby schools including Modoc High School and New Day Academy.
Ownership History
Date
Name
Owned For
Owner Type
Purchase Details
Closed on
Apr 6, 2020
Sold by
Sanders Josiah W and Sanders Joanna R
Bought by
Betancourt Amanda and Betancourt Saul
Current Estimated Value
Home Financials for this Owner
Home Financials are based on the most recent Mortgage that was taken out on this home.
Original Mortgage
$85,858
Outstanding Balance
$76,060
Interest Rate
3.4%
Mortgage Type
New Conventional
Estimated Equity
$80,249
Purchase Details
Closed on
Apr 1, 2020
Sold by
Sanders Josiah W and Sanders Joanna R
Bought by
Betancourt Amanda and Betancourt Saul
Home Financials for this Owner
Home Financials are based on the most recent Mortgage that was taken out on this home.
Original Mortgage
$85,858
Outstanding Balance
$76,060
Interest Rate
3.4%
Mortgage Type
New Conventional
Estimated Equity
$80,249
Purchase Details
Closed on
Mar 24, 2017
Sold by
Erickson Susan and Chambers Dennis
Bought by
Sanders Josiah W and Sanders Joanna R
Create a Home Valuation Report for This Property
The Home Valuation Report is an in-depth analysis detailing your home's value as well as a comparison with similar homes in the area
Home Values in the Area
Average Home Value in this Area
Purchase History
| Date | Buyer | Sale Price | Title Company |
|---|---|---|---|
| Betancourt Amanda | $85,000 | Placer Title | |
| Betancourt Amanda | $85,000 | Placer Title | |
| Sanders Josiah W | $35,000 | Placer Title Company |
Source: Public Records
Mortgage History
| Date | Status | Borrower | Loan Amount |
|---|---|---|---|
| Open | Betancourt Amanda | $85,858 | |
| Closed | Betancourt Amanda | $85,858 |
Source: Public Records
Tax History Compared to Growth
Tax History
| Year | Tax Paid | Tax Assessment Tax Assessment Total Assessment is a certain percentage of the fair market value that is determined by local assessors to be the total taxable value of land and additions on the property. | Land | Improvement |
|---|---|---|---|---|
| 2025 | $1,099 | $92,954 | $6,614 | $86,340 |
| 2024 | $1,099 | $91,133 | $6,485 | $84,648 |
| 2023 | $1,081 | $89,347 | $6,358 | $82,989 |
| 2022 | $1,064 | $87,596 | $6,234 | $81,362 |
| 2021 | $1,061 | $85,879 | $6,112 | $79,767 |
| 2020 | $699 | $44,136 | $6,419 | $37,717 |
| 2019 | $621 | $43,272 | $6,294 | $36,978 |
| 2018 | $612 | $42,424 | $6,171 | $36,253 |
| 2017 | $632 | $37,364 | $3,156 | $34,208 |
| 2016 | $554 | $36,633 | $3,095 | $33,538 |
| 2015 | $549 | $36,084 | $3,049 | $33,035 |
| 2014 | $542 | $35,378 | $2,990 | $32,388 |
Source: Public Records
Map
Nearby Homes
- 1303 Oak St
- 200 E 14th St
- 0 N East A St
- 701 N East B St
- 1205 W 12th St
- 607 W 3rd St
- 108 NW A St
- 720 E 4th St
- 1400 W 11th St
- 101 N West A St
- 805 W 2nd St
- 1732 Pintail Dr
- 406 W Carlos St
- 201 W Carlos St
- 003-171-051-001 W Carlos St
- 301 Riverside St
- 003-253-003 Forrest Ave
- 301 Forrest Ave
- 206 E Mcdowell Ave
- 0 S Warner St