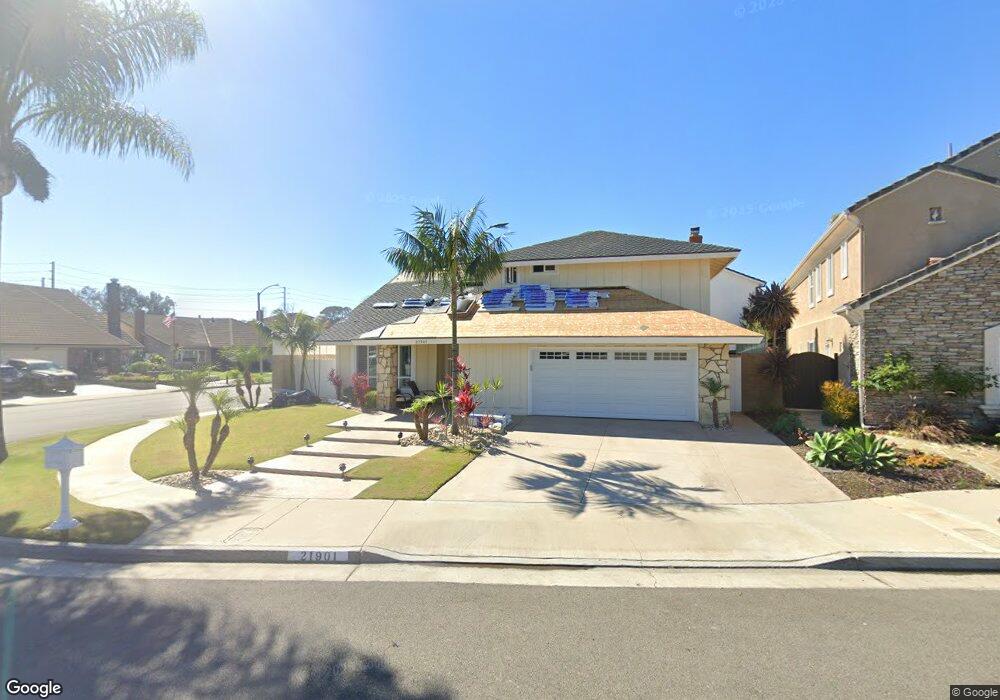
21901 Oceanbreeze Ln Huntington Beach, CA 92646
Southeast NeighborhoodEstimated Value: $1,800,000 - $2,208,916
4
Beds
3
Baths
2,342
Sq Ft
$851/Sq Ft
Est. Value
About This Home
This home is located at 21901 Oceanbreeze Ln, Huntington Beach, CA 92646 and is currently estimated at $1,992,229, approximately $850 per square foot. 21901 Oceanbreeze Ln is a home located in Orange County with nearby schools including John H. Eader Elementary School, Isaac L. Sowers Middle School, and Edison High School.
Ownership History
Date
Name
Owned For
Owner Type
Purchase Details
Closed on
Jun 25, 2021
Sold by
Forest Roger D and Forest Kimberly M
Bought by
Forest Roger D and Forest Kimberly
Current Estimated Value
Purchase Details
Closed on
Feb 6, 2007
Sold by
Noser Gerald G and Noser Mary Jo Donnes
Bought by
Forest Roger D and Forest Kimberly M
Home Financials for this Owner
Home Financials are based on the most recent Mortgage that was taken out on this home.
Original Mortgage
$750,000
Interest Rate
6.2%
Mortgage Type
Purchase Money Mortgage
Purchase Details
Closed on
Sep 27, 2002
Sold by
Noser Gerald G and Noser Mary Jo Donnes
Bought by
Noser Gerald G and Noser Mary Jo Donnes
Home Financials for this Owner
Home Financials are based on the most recent Mortgage that was taken out on this home.
Original Mortgage
$101,000
Interest Rate
6.22%
Purchase Details
Closed on
Feb 27, 1995
Sold by
Noser Gerald G and Noser Mary Jo Donnes
Bought by
Noser Gerald G and Noser Mary Jo Donnes
Create a Home Valuation Report for This Property
The Home Valuation Report is an in-depth analysis detailing your home's value as well as a comparison with similar homes in the area
Home Values in the Area
Average Home Value in this Area
Purchase History
| Date | Buyer | Sale Price | Title Company |
|---|---|---|---|
| Forest Roger D | -- | None Available | |
| Forest Roger D | $950,000 | Landamerica Commonwealth Tit | |
| Noser Gerald G | -- | First American Title Co | |
| Noser Gerald G | -- | -- |
Source: Public Records
Mortgage History
| Date | Status | Borrower | Loan Amount |
|---|---|---|---|
| Previous Owner | Forest Roger D | $750,000 | |
| Previous Owner | Noser Gerald G | $101,000 |
Source: Public Records
Tax History Compared to Growth
Tax History
| Year | Tax Paid | Tax Assessment Tax Assessment Total Assessment is a certain percentage of the fair market value that is determined by local assessors to be the total taxable value of land and additions on the property. | Land | Improvement |
|---|---|---|---|---|
| 2025 | $14,073 | $1,272,792 | $1,028,232 | $244,560 |
| 2024 | $14,073 | $1,247,836 | $1,008,071 | $239,765 |
| 2023 | $13,760 | $1,223,369 | $988,305 | $235,064 |
| 2022 | $13,279 | $1,188,300 | $968,927 | $219,373 |
| 2021 | $13,030 | $1,165,000 | $949,928 | $215,072 |
| 2020 | $11,866 | $1,054,680 | $865,646 | $189,034 |
| 2019 | $11,721 | $1,034,000 | $848,672 | $185,328 |
| 2018 | $11,764 | $1,034,000 | $848,672 | $185,328 |
| 2017 | $11,034 | $962,457 | $777,129 | $185,328 |
| 2016 | $10,743 | $962,457 | $777,129 | $185,328 |
| 2015 | $10,641 | $948,000 | $765,455 | $182,545 |
| 2014 | $9,384 | $834,873 | $652,328 | $182,545 |
Source: Public Records
Map
Nearby Homes
- 21861 Vacation Ln
- 21941 Oceanview Ln
- 21662 Brookhurst St Unit D
- 22102 Wood Island Ln
- 9552 Castine Dr
- 21382 Lemontree Ln
- 1170 Gleneagles Terrace
- 1269 Westreef
- 1 Starfish Ct Unit 40
- 21621 Kaneohe Ln
- 5 Sand Dollar Ct Unit 16
- 9121 Christine Dr
- 9171 Regatta Dr
- 1872 Parkview Cir
- 1789 Nantucket Place
- 9 Sundance Dr Unit 41
- 9 Sandflower Ct Unit 5
- 2175 Pacific Ave Unit C1
- 9021 Niguel Cir
- 1947 Sundance Ln
- 21891 Oceanbreeze Ln
- 21891 Summerwind Ln
- 21922 Summerwind Ln
- 21881 Oceanbreeze Ln
- 21912 Summerwind Ln
- 21932 Summerwind Ln
- 21912 Harborbreeze Ln
- 21902 Summerwind Ln
- 21922 Harborbreeze Ln
- 21942 Summerwind Ln
- 21902 Harborbreeze Ln
- 21881 Summerwind Ln
- 21871 Oceanbreeze Ln
- 21932 Harborbreeze Ln
- 21892 Summerwind Ln
- 21892 Harborbreeze Ln
- 21952 Summerwind Ln
- 21862 Oceanbreeze Ln
- 21942 Harborbreeze Ln
- 21861 Summerwind Ln