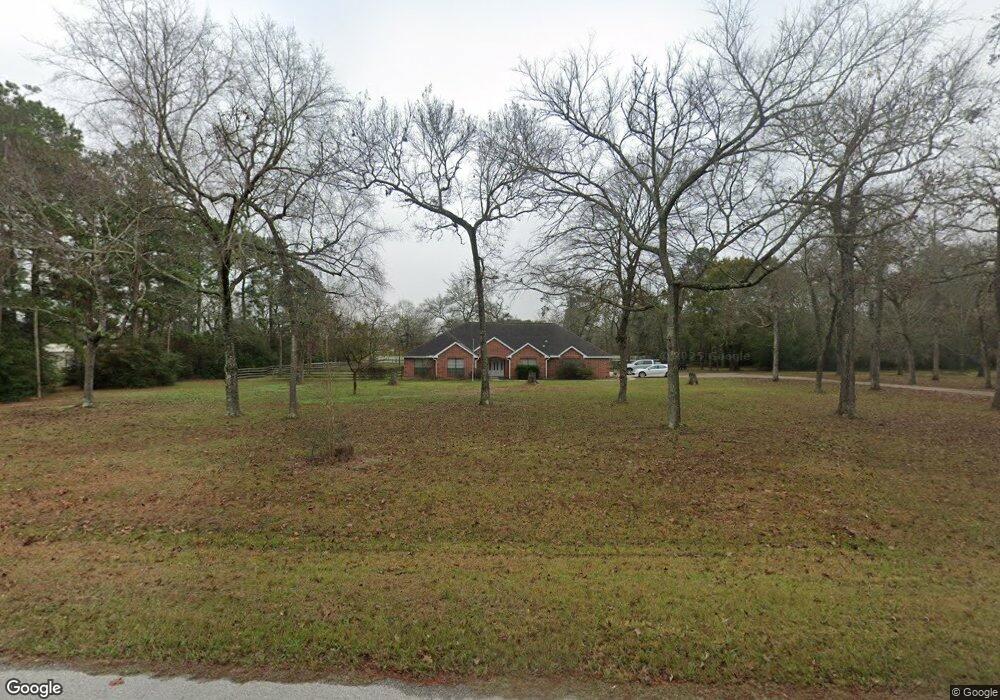
21903 Vinton Ln Magnolia, TX 77355
Clear Creek Forest NeighborhoodEstimated Value: $530,000 - $645,000
3
Beds
3
Baths
2,962
Sq Ft
$201/Sq Ft
Est. Value
About This Home
This home is located at 21903 Vinton Ln, Magnolia, TX 77355 and is currently estimated at $595,800, approximately $201 per square foot. 21903 Vinton Ln is a home located in Montgomery County with nearby schools including J.L. Lyon Elementary School, Magnolia Sixth Grade Campus, and Magnolia Junior High School.
Ownership History
Date
Name
Owned For
Owner Type
Purchase Details
Closed on
Jan 27, 2005
Sold by
Aurora Loan Services Inc
Bought by
Crissman Paul and Crissman Mary Cay
Current Estimated Value
Purchase Details
Closed on
Oct 28, 2004
Sold by
Mortgage Electronic Registration Systems
Bought by
Aurora Loan Services Inc
Purchase Details
Closed on
Jul 6, 2004
Sold by
Ansley Maria
Bought by
Mortgage Electronic Registration Systems
Purchase Details
Closed on
Dec 31, 2002
Sold by
Lumpkin Michael Glenn and Lumpkin Lyndsey Elizabeth
Bought by
Ansley Maria
Home Financials for this Owner
Home Financials are based on the most recent Mortgage that was taken out on this home.
Original Mortgage
$295,000
Interest Rate
8.87%
Purchase Details
Closed on
Oct 3, 1995
Sold by
Preston Johnny E and Preston Tracy L
Bought by
Bartlett Curtis W and Bartlett Pamela S
Home Financials for this Owner
Home Financials are based on the most recent Mortgage that was taken out on this home.
Original Mortgage
$16,290
Interest Rate
7.84%
Mortgage Type
Seller Take Back
Create a Home Valuation Report for This Property
The Home Valuation Report is an in-depth analysis detailing your home's value as well as a comparison with similar homes in the area
Home Values in the Area
Average Home Value in this Area
Purchase History
| Date | Buyer | Sale Price | Title Company |
|---|---|---|---|
| Crissman Paul | -- | Fidelity National Title #29 | |
| Aurora Loan Services Inc | -- | Fidelity National Title #29 | |
| Mortgage Electronic Registration Systems | $205,000 | -- | |
| Ansley Maria | -- | Lawyers Title | |
| Bartlett Curtis W | -- | -- |
Source: Public Records
Mortgage History
| Date | Status | Borrower | Loan Amount |
|---|---|---|---|
| Previous Owner | Ansley Maria | $295,000 | |
| Previous Owner | Bartlett Curtis W | $16,290 |
Source: Public Records
Tax History Compared to Growth
Tax History
| Year | Tax Paid | Tax Assessment Tax Assessment Total Assessment is a certain percentage of the fair market value that is determined by local assessors to be the total taxable value of land and additions on the property. | Land | Improvement |
|---|---|---|---|---|
| 2025 | $1,889 | $463,675 | $120,000 | $343,675 |
| 2024 | $1,850 | $472,989 | -- | -- |
| 2023 | $1,850 | $429,990 | $120,000 | $381,050 |
| 2022 | $6,898 | $390,900 | $115,840 | $398,510 |
| 2021 | $6,605 | $355,360 | $64,000 | $341,610 |
| 2020 | $6,538 | $323,050 | $64,000 | $278,340 |
| 2019 | $5,914 | $293,680 | $64,000 | $229,680 |
| 2018 | $5,541 | $315,580 | $56,000 | $259,580 |
| 2017 | $6,172 | $291,040 | $56,000 | $278,030 |
| 2016 | $5,610 | $264,580 | $56,000 | $282,830 |
| 2015 | $3,697 | $240,530 | $56,000 | $299,470 |
| 2014 | $3,697 | $218,660 | $18,000 | $224,070 |
Source: Public Records
Map
Nearby Homes
- 21610 Meadowsweet Dr
- 26115 Country Woods Trail
- 22219 Rainfern Dr
- 19830 Turtle Dove Ln
- 19910 Turtle Creek Ln
- 22403 Meadowsweet Dr
- 17447 Country Skies
- 17910 Sea Turtle Ct
- 22102 Badger Hollow Dr
- 27141 Nichols Sawmill Rd
- 26603 N Marek Ln
- 26523 S Carrol Ln
- 21242 Natalia Grove
- 22710 Meadowsweet Dr
- 27119 Seahorse Ln
- 27011 Sunset Dr
- 22922 Blackgum Dr
- TBD Fitz Ln
- 22806 Lantana Dr
- 26530 S Dogwood Ln
- 21911 Vinton Ln
- 21811 Vinton Ln
- LOT 11 Gromwell
- 24410 Chipwood Dr
- XX Chipwood
- 21877 Vinton Ln
- 24407 Bridgewater Dr
- 24914 Jacana Dr
- 24415 Chipwood Dr
- 24418 Chipwood Dr
- Lot 17 Bridgewater
- 24402 Bridgewater Dr
- 24407 Bumble Bee Ct
- 25722 Nichols Sawmill Rd
- 24910 Jacana Dr
- 24502 Chipwood Dr
- 22403 Gromwell Dr
- 24503 Chipwood Dr
- 000 Bumblebee Ct
- 25850 Nichols Sawmill Rd