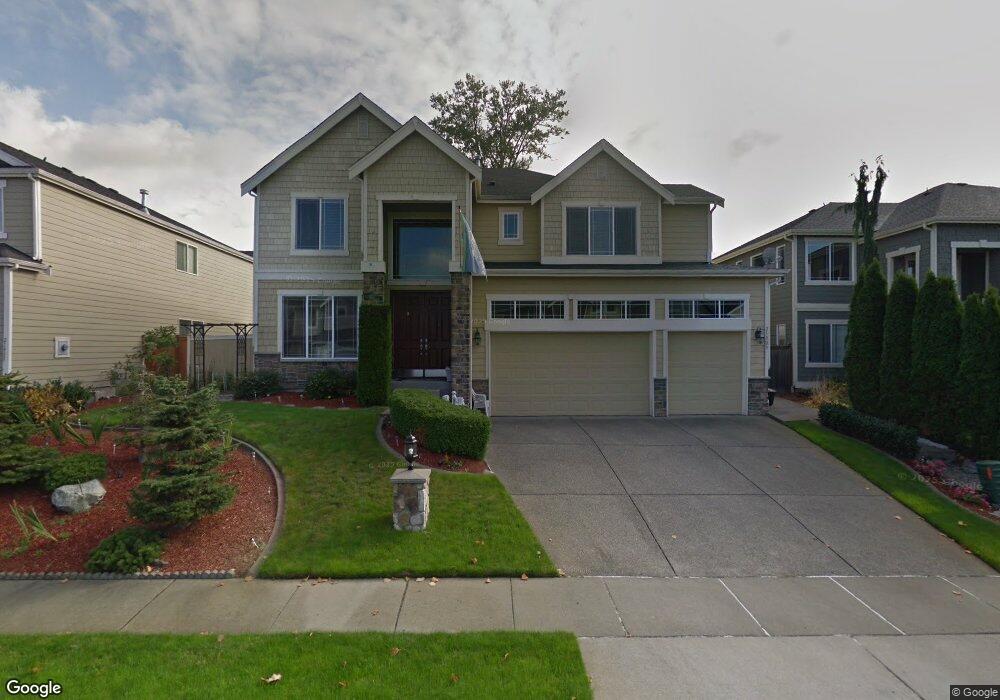
21909 40th Ave SE Bothell, WA 98021
Canyon Creek NeighborhoodEstimated Value: $1,407,420 - $1,591,000
4
Beds
3
Baths
3,077
Sq Ft
$492/Sq Ft
Est. Value
About This Home
This home is located at 21909 40th Ave SE, Bothell, WA 98021 and is currently estimated at $1,515,355, approximately $492 per square foot. 21909 40th Ave SE is a home located in Snohomish County with nearby schools including Kokanee Elementary School, Leota Middle School, and North Creek High School.
Ownership History
Date
Name
Owned For
Owner Type
Purchase Details
Closed on
Apr 20, 2012
Sold by
Nand Gyaneshwar and Nand Sushilmati
Bought by
Nand Lajeshwar and Nand Vandana Raj
Current Estimated Value
Home Financials for this Owner
Home Financials are based on the most recent Mortgage that was taken out on this home.
Original Mortgage
$309,500
Outstanding Balance
$29,556
Interest Rate
3.1%
Mortgage Type
New Conventional
Estimated Equity
$1,485,799
Purchase Details
Closed on
Mar 20, 2006
Sold by
Nand Lajeswar and Nand Vandana
Bought by
Nand Lajeswar and Nand Vandana
Purchase Details
Closed on
Jan 5, 2006
Sold by
Bennett Homes Inc
Bought by
Nand Lajeshwar and Nand Vandana Raj
Home Financials for this Owner
Home Financials are based on the most recent Mortgage that was taken out on this home.
Original Mortgage
$189,040
Interest Rate
6.25%
Mortgage Type
Credit Line Revolving
Create a Home Valuation Report for This Property
The Home Valuation Report is an in-depth analysis detailing your home's value as well as a comparison with similar homes in the area
Home Values in the Area
Average Home Value in this Area
Purchase History
| Date | Buyer | Sale Price | Title Company |
|---|---|---|---|
| Nand Lajeshwar | -- | First American Title Ins Co | |
| Nand Lajeswar | -- | Talon Group | |
| Nand Lajeshwar | $580,080 | First American Title Ins Co |
Source: Public Records
Mortgage History
| Date | Status | Borrower | Loan Amount |
|---|---|---|---|
| Open | Nand Lajeshwar | $309,500 | |
| Closed | Nand Lajeshwar | $189,040 | |
| Closed | Nand Lajeshwar | $274,800 |
Source: Public Records
Tax History
| Year | Tax Paid | Tax Assessment Tax Assessment Total Assessment is a certain percentage of the fair market value that is determined by local assessors to be the total taxable value of land and additions on the property. | Land | Improvement |
|---|---|---|---|---|
| 2026 | $10,445 | $1,325,600 | $855,000 | $470,600 |
| 2025 | $9,569 | $1,167,300 | $715,000 | $452,300 |
| 2024 | $9,569 | $1,069,300 | $627,000 | $442,300 |
| 2023 | $9,853 | $1,227,900 | $725,000 | $502,900 |
| 2022 | $9,324 | $924,400 | $440,000 | $484,400 |
| 2020 | $9,093 | $851,500 | $403,000 | $448,500 |
| 2019 | $8,299 | $786,300 | $320,000 | $466,300 |
| 2018 | $7,889 | $696,100 | $280,000 | $416,100 |
| 2017 | $6,863 | $616,300 | $225,000 | $391,300 |
| 2016 | $6,614 | $579,800 | $205,000 | $374,800 |
| 2015 | $6,666 | $555,500 | $191,000 | $364,500 |
| 2013 | $5,765 | $427,200 | $157,000 | $270,200 |
Source: Public Records
Map
Nearby Homes
- 4103 220th St SE
- 4215 220th St SE
- 4219 220th St SE
- 21813 38th Dr SE
- 3931 221st Place SE
- 4118 220th Place SE
- 4132 220th St SE
- 4123 220th Place SE
- 4026 215th Place SE
- 4001 215th St SE Unit A
- 4415 220th St SE
- 3928 214th Place SE Unit B
- 21927 44th Dr SE
- 3626 222nd Place SE
- 4214 223rd Place SE
- 4426 216th Place SE
- 21417 43rd Dr SE Unit 19
- 4215 228th St SE
- 22724 41st Dr SE
- 22222 49th Ave SE
- 21915 40th Ave SE
- 21905 40th Ave SE
- 4016 219th St SE
- 21920 41st Ave SE
- 4109 220th St SE
- 21912 40th Ave SE
- 21906 40th Ave SE
- 21927 40th Ave SE
- 21926 41st Ave SE
- 4007 219th St SE
- 21924 40th Ave SE
- 21914 41st Ave SE
- 4013 219th St SE
- 4001 219th St SE
- 21909 39th Dr SE
- 21903 39th Dr SE
- 4118 220th St SE
- 21933 40th Ave SE
- 21915 39th Dr SE
- 4019 219th St SE
Your Personal Tour Guide
Ask me questions while you tour the home.