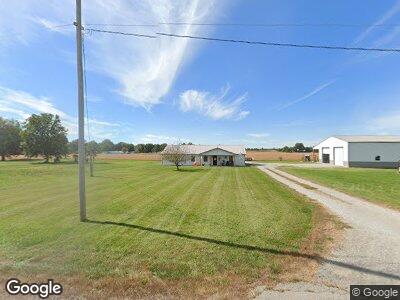
21909 Highway 127 Vergennes, IL 62994
Estimated Value: $105,000
4
Beds
2
Baths
1,800
Sq Ft
$58/Sq Ft
Est. Value
About This Home
This home is located at 21909 Highway 127, Vergennes, IL 62994 and is currently priced at $105,000, approximately $58 per square foot. 21909 Highway 127 is a home located in Jackson County with nearby schools including Elverado Intermediate School and Elverado Junior High School.
Ownership History
Date
Name
Owned For
Owner Type
Purchase Details
Closed on
Jun 1, 2021
Sold by
Mitchell Noah R and Mitchell Dalton J
Bought by
Mitchell Noah R and Mitchell Dalton J
Current Estimated Value
Purchase Details
Closed on
May 12, 2015
Sold by
Ward Sandra and Doerr Amy Sue
Bought by
Ward Sandra S
Home Financials for this Owner
Home Financials are based on the most recent Mortgage that was taken out on this home.
Original Mortgage
$172,500
Interest Rate
2.93%
Mortgage Type
Reverse Mortgage Home Equity Conversion Mortgage
Purchase Details
Closed on
Sep 5, 2013
Sold by
Ward Sandra
Bought by
Ward Sandra and Ward Ronald M
Home Financials for this Owner
Home Financials are based on the most recent Mortgage that was taken out on this home.
Original Mortgage
$50,000
Interest Rate
3.53%
Mortgage Type
Unknown
Purchase Details
Closed on
Mar 6, 2009
Sold by
Doerr Vicki L
Bought by
Ward Sandra
Purchase Details
Closed on
Dec 14, 2006
Sold by
Doerr Jason R and Doerr Amy
Bought by
Ward Sandra
Create a Home Valuation Report for This Property
The Home Valuation Report is an in-depth analysis detailing your home's value as well as a comparison with similar homes in the area
Home Values in the Area
Average Home Value in this Area
Purchase History
| Date | Buyer | Sale Price | Title Company |
|---|---|---|---|
| Mitchell Noah R | -- | None Available | |
| Ward Sandra S | -- | None Available | |
| Ward Sandra | -- | None Available | |
| Ward Sandra | $3,750 | None Available | |
| Ward Sandra | $82,500 | None Available |
Source: Public Records
Mortgage History
| Date | Status | Borrower | Loan Amount |
|---|---|---|---|
| Closed | Mitchell Noah R | -- | |
| Previous Owner | Mitchell Noah R | $93,120 | |
| Previous Owner | Ward Sandra S | $172,500 | |
| Previous Owner | Ward Sandra | $50,000 |
Source: Public Records
Tax History Compared to Growth
Tax History
| Year | Tax Paid | Tax Assessment Tax Assessment Total Assessment is a certain percentage of the fair market value that is determined by local assessors to be the total taxable value of land and additions on the property. | Land | Improvement |
|---|---|---|---|---|
| 2021 | $2,160 | $36,015 | $1,784 | $34,231 |
| 2020 | $2,259 | $37,332 | $1,816 | $35,516 |
| 2019 | $2,205 | $36,682 | $1,784 | $34,898 |
| 2018 | $2,147 | $36,682 | $1,784 | $34,898 |
| 2017 | $1,773 | $35,558 | $1,784 | $33,774 |
| 2016 | $1,607 | $35,558 | $1,784 | $33,774 |
| 2015 | -- | $35,558 | $1,784 | $33,774 |
| 2014 | -- | $33,285 | $1,649 | $31,636 |
| 2012 | -- | $23,230 | $1,649 | $21,581 |
Source: Public Records
Map
Nearby Homes
- 0000 Ava Rd
- 3350 Elkville Rd
- 0 Coffer Rd
- 2647 Dowell Rd
- 000 Coffer Rd
- 75 Bedrock Ridge
- 155 Bedrock Ridge
- 116 Crooked Willow Dr
- 140 House Rd
- 222 House Rd
- 4765 Kimmel Bridge Rd
- 3048 Marlboro Rd
- 106 S 1st St
- 485 Martie Rd
- 381 Martie Rd
- 109 S 5th St
- 205 N 5th St
- 170 Brasel Dr
- 509 E Board St
- 603 Union St