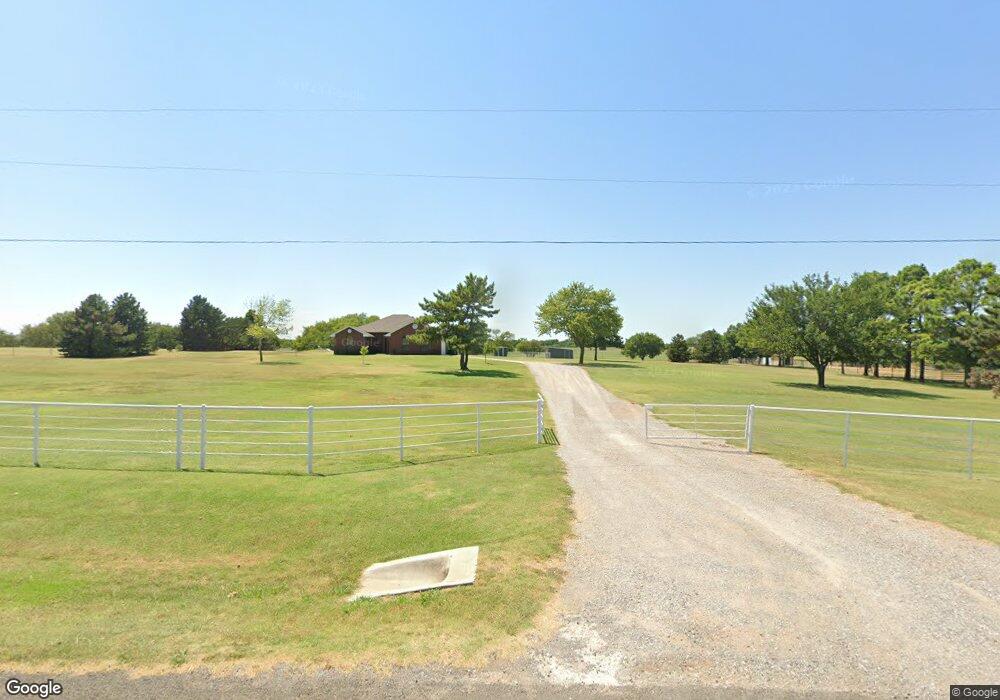
21909 Sooner Ave Purcell, OK 73080
Estimated Value: $265,000 - $298,794
3
Beds
2
Baths
1,622
Sq Ft
$174/Sq Ft
Est. Value
About This Home
This home is located at 21909 Sooner Ave, Purcell, OK 73080 and is currently estimated at $281,897, approximately $173 per square foot. 21909 Sooner Ave is a home located in McClain County with nearby schools including Purcell Elementary School, Purcell Intermediate School, and Purcell Junior High School.
Create a Home Valuation Report for This Property
The Home Valuation Report is an in-depth analysis detailing your home's value as well as a comparison with similar homes in the area
Tax History
| Year | Tax Paid | Tax Assessment Tax Assessment Total Assessment is a certain percentage of the fair market value that is determined by local assessors to be the total taxable value of land and additions on the property. | Land | Improvement |
|---|---|---|---|---|
| 2025 | $1,472 | $14,550 | $3,235 | $11,315 |
| 2024 | $1,426 | $14,127 | $3,141 | $10,986 |
| 2023 | $1,426 | $13,715 | $3,049 | $10,666 |
| 2022 | $1,322 | $13,316 | $2,977 | $10,339 |
| 2021 | $1,296 | $12,928 | $2,861 | $10,067 |
| 2020 | $1,244 | $12,552 | $2,755 | $9,797 |
| 2019 | $1,226 | $12,186 | $2,697 | $9,489 |
| 2018 | $1,177 | $11,830 | $2,592 | $9,238 |
| 2017 | $1,114 | $11,487 | $2,310 | $9,177 |
| 2016 | $1,091 | $11,152 | $2,226 | $8,926 |
| 2015 | $1,073 | $10,828 | $2,064 | $8,764 |
| 2014 | $1,028 | $10,512 | $2,130 | $8,382 |
Source: Public Records
Map
Nearby Homes
- 0 SE Ladd Ave & 210th St
- 0 SE Ladd Ae & 210th St Unit Lot E
- 23362 Johnson Ave
- 0000 Bryant Ave
- 22455 State Highway 74
- 22453 State Highway 74
- 23193 Grandview Ln
- 20267 Horse Ave
- 20196 Holiday Ct
- 19733 Johnson Ave
- 20224 Lampkin Trail
- 20309 Lampkin Trail
- 20308 Lampkin Trail
- 20260 Lampkin Trail
- 0 Oklahoma 39
- 1081 Blue Ridge Dr
- 1077 Blue Ridge Dr
- 1085 Blue Ridge Dr
- 1073 Blue Ridge Dr
- 1069 Blue Ridge Dr
- 21805 Sooner Ave
- 21845 Sooner Ave
- 21812 Sooner Ave
- 21940 Sooner Ave
- 21940 Sooner Ave
- 21940 Sooner Ave
- 21896 Sooner Ave
- 22015 Sooner Ave
- 23947 220th St
- 0 Sooner Ave
- 26169 Sooner Ave
- 21745 Sooner Ave
- 23711 220th St
- 21595 Sooner Ave
- 21576 Sooner Ave
- 23592 220th St
- 21507 Sooner Ave
- 21483 Sooner Ave
- 21381 Sooner Ave
- 23494 220th St
Your Personal Tour Guide
Ask me questions while you tour the home.