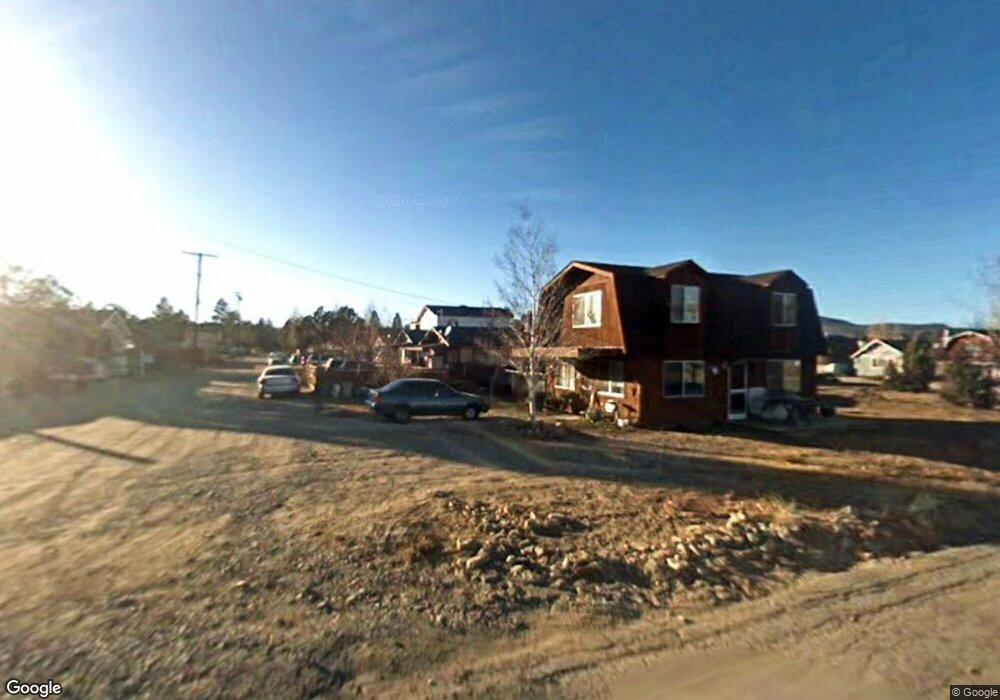
2191 5th Ln Big Bear City, CA 92314
Estimated Value: $216,959 - $264,000
2
Beds
1
Bath
640
Sq Ft
$382/Sq Ft
Est. Value
About This Home
This home is located at 2191 5th Ln, Big Bear City, CA 92314 and is currently estimated at $244,490, approximately $382 per square foot. 2191 5th Ln is a home located in San Bernardino County with nearby schools including Baldwin Lane Elementary School, Big Bear Middle School, and Big Bear High School.
Ownership History
Date
Name
Owned For
Owner Type
Purchase Details
Closed on
Aug 16, 1993
Sold by
Chudabala Sunandha
Bought by
Flores Angel and Flores Guillermina
Current Estimated Value
Home Financials for this Owner
Home Financials are based on the most recent Mortgage that was taken out on this home.
Original Mortgage
$43,823
Interest Rate
6.94%
Mortgage Type
FHA
Create a Home Valuation Report for This Property
The Home Valuation Report is an in-depth analysis detailing your home's value as well as a comparison with similar homes in the area
Home Values in the Area
Average Home Value in this Area
Purchase History
| Date | Buyer | Sale Price | Title Company |
|---|---|---|---|
| Flores Angel | $43,000 | First American Title Insuran |
Source: Public Records
Mortgage History
| Date | Status | Borrower | Loan Amount |
|---|---|---|---|
| Previous Owner | Flores Angel | $43,823 |
Source: Public Records
Tax History
| Year | Tax Paid | Tax Assessment Tax Assessment Total Assessment is a certain percentage of the fair market value that is determined by local assessors to be the total taxable value of land and additions on the property. | Land | Improvement |
|---|---|---|---|---|
| 2025 | $2,345 | $73,086 | $18,359 | $54,727 |
| 2024 | $2,234 | $71,653 | $17,999 | $53,654 |
| 2023 | $2,152 | $70,248 | $17,646 | $52,602 |
| 2022 | $1,695 | $68,871 | $17,300 | $51,571 |
| 2021 | $1,646 | $67,521 | $16,961 | $50,560 |
| 2020 | $1,621 | $66,829 | $16,787 | $50,042 |
| 2019 | $1,584 | $65,519 | $16,458 | $49,061 |
| 2018 | $1,518 | $64,234 | $16,135 | $48,099 |
| 2017 | $1,468 | $62,975 | $15,819 | $47,156 |
| 2016 | $1,426 | $61,740 | $15,509 | $46,231 |
| 2015 | $1,394 | $60,813 | $15,276 | $45,537 |
| 2014 | $1,365 | $59,622 | $14,977 | $44,645 |
Source: Public Records
Map
Nearby Homes
- 2187 5th Ln
- 2187 6th Ln
- 2165 3rd Ln
- 2155 3rd Ln
- 2136 5th Ln
- 849 Hemlock Ln
- 2189 1st Ln
- 936 Pinon Ln
- 0 Hemlock Ln Unit 32406193
- 0 Hemlock Ln Unit IG25049783
- 0 Hemlock Ln Unit OC26025819
- 2136 3rd Ln
- 1056 Willow Ln
- 0 5th Ln
- 969 Hemlock Ln
- 972 Pinon Ln
- 0 7th Ln Unit 32405890
- 0 7th Ln Unit IG24216549
- 2125 4th Ln
- 0 2nd Ln
Your Personal Tour Guide
Ask me questions while you tour the home.