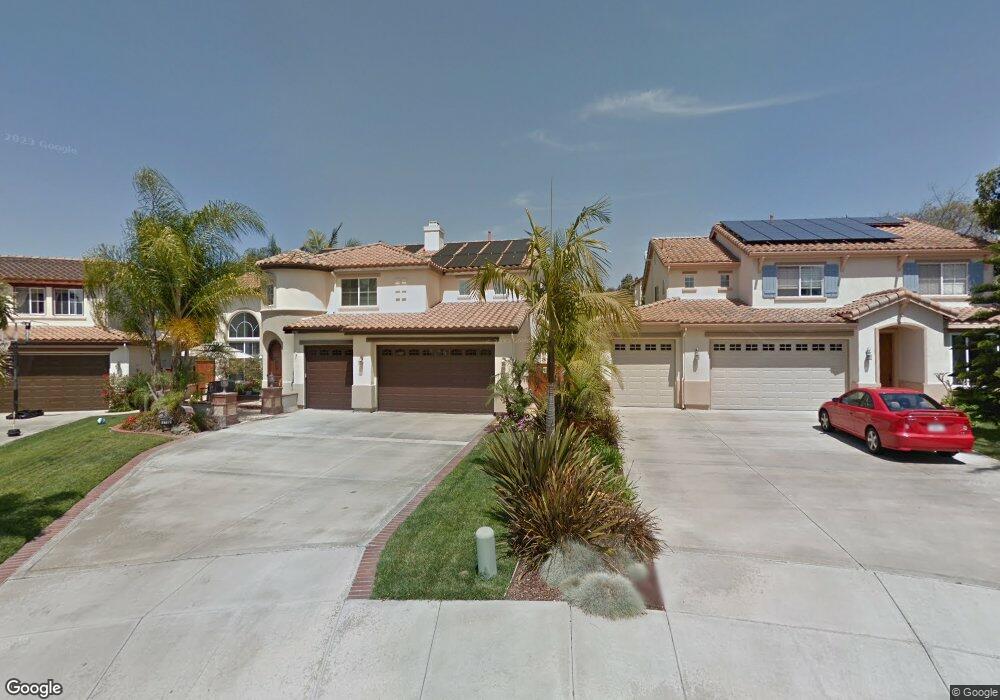
2192 Corte Limon Carlsbad, CA 92009
La Costa NeighborhoodEstimated Value: $1,934,000 - $2,082,918
4
Beds
3
Baths
2,788
Sq Ft
$713/Sq Ft
Est. Value
About This Home
This home is located at 2192 Corte Limon, Carlsbad, CA 92009 and is currently estimated at $1,988,480, approximately $713 per square foot. 2192 Corte Limon is a home located in San Diego County with nearby schools including El Camino Creek Elementary School, Oak Crest Middle School, and La Costa Canyon High School.
Ownership History
Date
Name
Owned For
Owner Type
Purchase Details
Closed on
Apr 11, 2012
Sold by
Revell Kelly M and Revell Andrea L
Bought by
Revell Kelly M and Revell Andrea L
Current Estimated Value
Home Financials for this Owner
Home Financials are based on the most recent Mortgage that was taken out on this home.
Original Mortgage
$339,000
Outstanding Balance
$34,641
Interest Rate
3.1%
Mortgage Type
New Conventional
Estimated Equity
$1,953,839
Purchase Details
Closed on
Oct 29, 2008
Sold by
Revell Kelly M and Revell Andrea L
Bought by
Revell Kelly M and Revell Andrea L
Purchase Details
Closed on
May 13, 1998
Sold by
Greystone Homes Inc
Bought by
Revell Kelly M and Revell Andrea L
Home Financials for this Owner
Home Financials are based on the most recent Mortgage that was taken out on this home.
Original Mortgage
$150,000
Interest Rate
6.88%
Create a Home Valuation Report for This Property
The Home Valuation Report is an in-depth analysis detailing your home's value as well as a comparison with similar homes in the area
Home Values in the Area
Average Home Value in this Area
Purchase History
| Date | Buyer | Sale Price | Title Company |
|---|---|---|---|
| Revell Kelly M | -- | Accommodation | |
| Revell Kelly M | -- | Equity Title Company | |
| Revell Kelly M | -- | None Available | |
| Revell Kelly M | -- | None Available | |
| Revell Kelly M | $395,000 | Lawyers Title |
Source: Public Records
Mortgage History
| Date | Status | Borrower | Loan Amount |
|---|---|---|---|
| Open | Revell Kelly M | $339,000 | |
| Previous Owner | Revell Kelly M | $150,000 |
Source: Public Records
Tax History
| Year | Tax Paid | Tax Assessment Tax Assessment Total Assessment is a certain percentage of the fair market value that is determined by local assessors to be the total taxable value of land and additions on the property. | Land | Improvement |
|---|---|---|---|---|
| 2025 | $8,440 | $683,766 | $235,144 | $448,622 |
| 2024 | $8,440 | $670,360 | $230,534 | $439,826 |
| 2023 | $8,218 | $657,216 | $226,014 | $431,202 |
| 2022 | $8,039 | $644,331 | $221,583 | $422,748 |
| 2021 | $7,915 | $631,698 | $217,239 | $414,459 |
| 2020 | $7,798 | $625,222 | $215,012 | $410,210 |
| 2019 | $7,659 | $612,964 | $210,797 | $402,167 |
| 2018 | $7,543 | $600,946 | $206,664 | $394,282 |
| 2017 | $7,427 | $589,163 | $202,612 | $386,551 |
| 2016 | $7,224 | $577,612 | $198,640 | $378,972 |
| 2015 | $7,108 | $568,937 | $195,657 | $373,280 |
| 2014 | $6,960 | $557,793 | $191,825 | $365,968 |
Source: Public Records
Map
Nearby Homes
- 1080 Primrose Ln
- 2712 Mateo Place
- 2063 Wandering Rd
- 7768 Caminito Monarca Unit 109
- 7767 Caminito Monarca Unit 100
- 2204 Recodo Ct
- 8092 Paseo Arrayan
- 1402 Village View Rd
- 2002 Ladera Ct
- 1693 Honeysuckle Ct
- 7945 Calle Madrid
- 7941 Calle Madrid Unit 4
- 1502 Vanessa Cir
- 2904 Levante St
- 2927 Levante St
- 2120 Pintoresco Ct
- 1842 Avenida Mimosa
- 2124 Pintoresco Ct
- 444 N El Camino Real Unit 47
- 444 N El Camino Real Unit 48
- 2196 Corte Limon
- 2188 Corte Limon
- 7949 Grado el Tupelo
- 7945 Grado el Tupelo
- 7933 Grado el Tupelo
- 7937 Grado el Tupelo
- 7953 Grado el Tupelo
- 2184 Corte Limon
- 7941 Grado el Tupelo
- 2193 Corte Limon
- 7929 Grado el Tupelo
- 7957 Grado el Tupelo
- 2189 Corte Limon
- 2180 Corte Limon
- 2185 Corte Limon
- 7961 Grado el Tupelo
- 7925 Grado el Tupelo
- 2181 Corte Limon
- 7956 Grado el Tupelo
- 7960 Grado el Tupelo
Your Personal Tour Guide
Ask me questions while you tour the home.