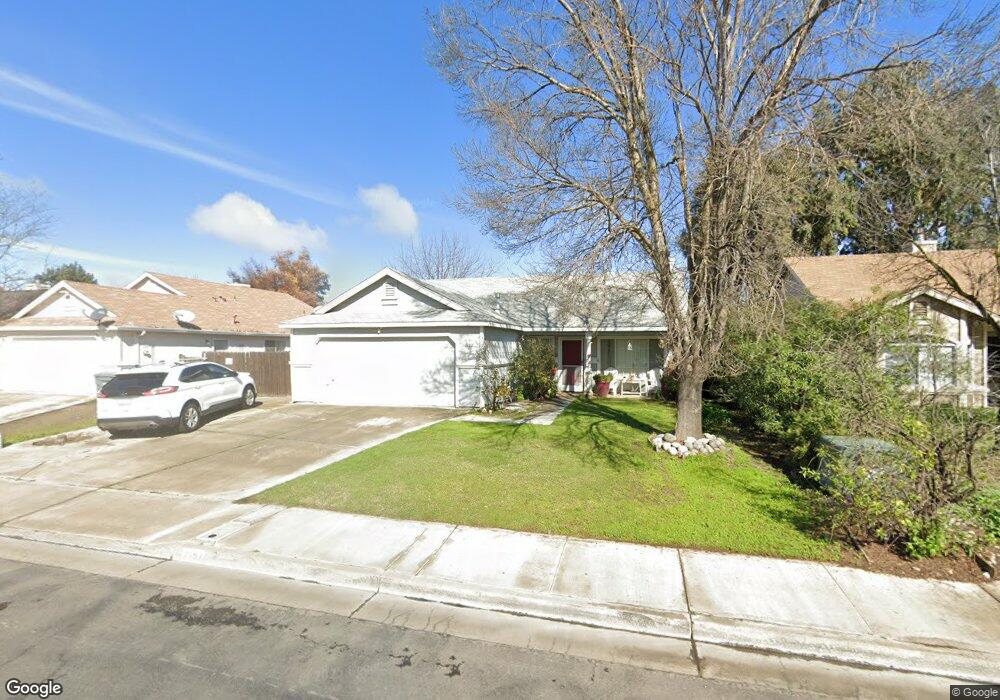
2192 Huntington Dr Los Banos, CA 93635
Estimated Value: $299,000 - $397,000
3
Beds
2
Baths
1,106
Sq Ft
$316/Sq Ft
Est. Value
About This Home
This home is located at 2192 Huntington Dr, Los Banos, CA 93635 and is currently estimated at $349,096, approximately $315 per square foot. 2192 Huntington Dr is a home located in Merced County with nearby schools including Mercey Springs Elementary School, Los Banos Junior High School, and Pacheco High School.
Ownership History
Date
Name
Owned For
Owner Type
Purchase Details
Closed on
Nov 8, 2011
Sold by
Federal Home Loan Mortgage Corporation
Bought by
Vaz Evaristo J
Current Estimated Value
Purchase Details
Closed on
Apr 1, 2011
Sold by
Townsend Naomi
Bought by
Federal Home Loan Mortgage Corporation
Purchase Details
Closed on
Mar 13, 2001
Sold by
Salazar Frank A and Salazar Sondra E
Bought by
Townsend Naomi
Home Financials for this Owner
Home Financials are based on the most recent Mortgage that was taken out on this home.
Original Mortgage
$137,550
Interest Rate
8.25%
Mortgage Type
Purchase Money Mortgage
Purchase Details
Closed on
Apr 8, 1998
Sold by
Anthony Clement and Anthony Michelle
Bought by
Salazar Frank A and Salazar Sondra E
Home Financials for this Owner
Home Financials are based on the most recent Mortgage that was taken out on this home.
Original Mortgage
$91,922
Interest Rate
7.13%
Mortgage Type
FHA
Create a Home Valuation Report for This Property
The Home Valuation Report is an in-depth analysis detailing your home's value as well as a comparison with similar homes in the area
Home Values in the Area
Average Home Value in this Area
Purchase History
| Date | Buyer | Sale Price | Title Company |
|---|---|---|---|
| Vaz Evaristo J | $80,000 | Lsi Title Company | |
| Federal Home Loan Mortgage Corporation | $94,406 | Accommodation | |
| Townsend Naomi | $172,000 | Fidelity National Title Co | |
| Salazar Frank A | $92,000 | Fidelity National Title Co |
Source: Public Records
Mortgage History
| Date | Status | Borrower | Loan Amount |
|---|---|---|---|
| Previous Owner | Townsend Naomi | $137,550 | |
| Previous Owner | Salazar Frank A | $91,922 | |
| Closed | Townsend Naomi | $34,400 |
Source: Public Records
Tax History Compared to Growth
Tax History
| Year | Tax Paid | Tax Assessment Tax Assessment Total Assessment is a certain percentage of the fair market value that is determined by local assessors to be the total taxable value of land and additions on the property. | Land | Improvement |
|---|---|---|---|---|
| 2025 | $1,424 | $100,470 | $16,322 | $84,148 |
| 2024 | $1,424 | $98,501 | $16,002 | $82,499 |
| 2023 | $1,343 | $96,571 | $15,689 | $80,882 |
| 2022 | $1,308 | $94,679 | $15,382 | $79,297 |
| 2021 | $1,274 | $92,824 | $15,081 | $77,743 |
| 2020 | $1,241 | $91,873 | $14,927 | $76,946 |
| 2019 | $1,217 | $90,073 | $14,635 | $75,438 |
| 2018 | $1,179 | $88,308 | $14,349 | $73,959 |
| 2017 | $1,163 | $86,577 | $14,068 | $72,509 |
| 2016 | $1,174 | $84,881 | $13,793 | $71,088 |
| 2015 | $1,154 | $83,607 | $13,586 | $70,021 |
| 2014 | $1,128 | $81,970 | $13,320 | $68,650 |
Source: Public Records
Map
Nearby Homes
- 2198 Canal Farm Ln
- 2191 Canal Farm Ln
- 2045 Edwards St
- 2075 Martin St
- 3224-3264 E Pacheco Blvd
- 2149 E Pacheco Blvd
- 2505 E Pacheco Blvd
- 2066 Greenbriar Dr
- 2527 E Pacheco Blvd
- 2080 Constantine Ct
- 2151 E Pacheco Blvd Unit 92
- 2271 Corsico Ct
- 2490 N Fallbrook Dr
- 256 Murano St
- 2095 Palermo Dr
- 2537 N Creekside Dr
- 1505 Sarba Ct
- 1501 Sarba Ct
- 2774 Swan Ln
- 1453 Willmott Rd
- 2184 Huntington Dr
- 2200 Huntington Dr
- 2203 San Luis St
- 2199 San Luis St
- 2178 Huntington Dr
- 2212 Huntington Dr
- 2207 San Luis St
- 2195 San Luis St
- 2193 Huntington Dr
- 2185 Huntington Dr
- 2205 Huntington Dr
- 2211 San Luis St
- 2172 Huntington Dr
- 2220 Huntington Dr
- 2191 San Luis St
- 2175 Huntington Dr
- 2213 Huntington Dr
- 2215 San Luis St
- 2173 Huntington Dr
- 2164 Huntington Dr