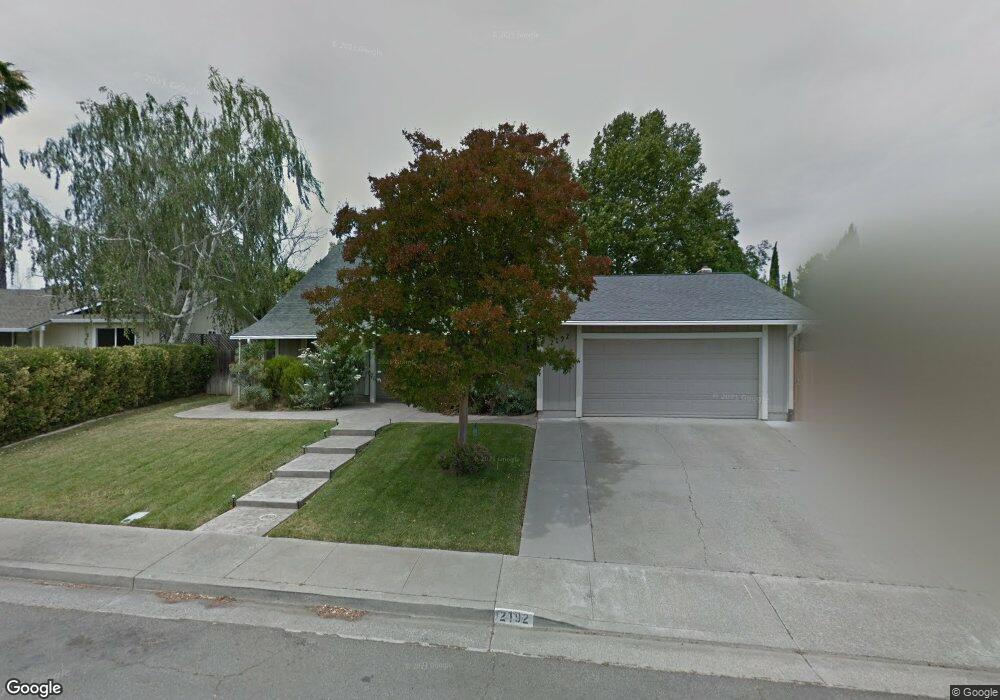
2192 Madrone Dr Fairfield, CA 94534
Estimated Value: $607,490 - $703,000
4
Beds
3
Baths
2,320
Sq Ft
$285/Sq Ft
Est. Value
About This Home
This home is located at 2192 Madrone Dr, Fairfield, CA 94534 and is currently estimated at $660,623, approximately $284 per square foot. 2192 Madrone Dr is a home located in Solano County with nearby schools including K. I. Jones Elementary School, Angelo Rodriguez High School, and Solano Christian Academy.
Ownership History
Date
Name
Owned For
Owner Type
Purchase Details
Closed on
Apr 6, 2022
Sold by
Protsman Michael L and Protsman Robin B
Bought by
Michael And Robin Protsman Family Trust
Current Estimated Value
Home Financials for this Owner
Home Financials are based on the most recent Mortgage that was taken out on this home.
Original Mortgage
$227,000
Outstanding Balance
$210,534
Interest Rate
3.76%
Mortgage Type
New Conventional
Estimated Equity
$450,089
Purchase Details
Closed on
Jan 12, 2018
Sold by
Protsman Michael L and Protsman Robin B
Bought by
Protsman Michael L and Protsman Robin B
Purchase Details
Closed on
Dec 8, 1998
Sold by
Nagle Steven H and Nagle Shiela L
Bought by
Protsman Michael L and Protsman Robin B
Home Financials for this Owner
Home Financials are based on the most recent Mortgage that was taken out on this home.
Original Mortgage
$197,829
Interest Rate
6.78%
Mortgage Type
VA
Purchase Details
Closed on
Nov 2, 1994
Sold by
Albert Karl J and Albert Peggy A
Bought by
Nagle Steven H and Evans Shiela L
Home Financials for this Owner
Home Financials are based on the most recent Mortgage that was taken out on this home.
Original Mortgage
$170,500
Interest Rate
5.75%
Create a Home Valuation Report for This Property
The Home Valuation Report is an in-depth analysis detailing your home's value as well as a comparison with similar homes in the area
Purchase History
| Date | Buyer | Sale Price | Title Company |
|---|---|---|---|
| Michael And Robin Protsman Family Trust | -- | Old Republic Title | |
| Protsman Michael L | -- | Old Republic Title | |
| Protsman Michael L | -- | None Available | |
| Protsman Michael L | $194,000 | Chicago Title Co | |
| Nagle Steven H | $189,500 | Placer Title Company |
Source: Public Records
Mortgage History
| Date | Status | Borrower | Loan Amount |
|---|---|---|---|
| Open | Protsman Michael L | $227,000 | |
| Previous Owner | Protsman Michael L | $197,829 | |
| Previous Owner | Nagle Steven H | $170,500 |
Source: Public Records
Tax History
| Year | Tax Paid | Tax Assessment Tax Assessment Total Assessment is a certain percentage of the fair market value that is determined by local assessors to be the total taxable value of land and additions on the property. | Land | Improvement |
|---|---|---|---|---|
| 2025 | $3,409 | $304,129 | $78,379 | $225,750 |
| 2024 | $3,409 | $298,167 | $76,843 | $221,324 |
| 2023 | $3,304 | $292,322 | $75,337 | $216,985 |
| 2022 | $3,185 | $286,591 | $73,861 | $212,730 |
| 2021 | $3,153 | $280,972 | $72,413 | $208,559 |
| 2020 | $3,078 | $278,092 | $71,671 | $206,421 |
| 2019 | $3,001 | $272,640 | $70,266 | $202,374 |
| 2018 | $3,096 | $267,295 | $68,889 | $198,406 |
| 2017 | $2,952 | $262,055 | $67,539 | $194,516 |
| 2016 | $2,925 | $256,917 | $66,215 | $190,702 |
| 2015 | $2,730 | $253,059 | $65,221 | $187,838 |
| 2014 | $2,704 | $248,103 | $63,944 | $184,159 |
Source: Public Records
Map
Nearby Homes
- 3114 Lomita Ct
- 185 Canby Way
- 2125 Mecca Ct
- 2988 Rustle Ct
- 2795 Vista Palomar
- 2848 Howe Ct
- 3042 Potrero Way
- 2486 Del Monte Dr
- 2400 Merion Ct
- 2051 Barbour Dr
- 3456 Norwalk Place
- 3511 Norwalk Place
- 2707 Tuckaway Ct
- 2516 Bellevue Ct
- 3227 Balmoral Ct
- 1706 Barton Dr
- 2545 Vista Grande
- 3451 Nantucket Dr
- 3127 Cherry Valley Cir
- 1858 Barbour Dr
- 2186 Madrone Dr
- 2198 Madrone Dr
- 2945 Vista Grande
- 2939 Vista Grande
- 2951 Vista Grande
- 2180 Madrone Dr
- 2204 Madrone Dr
- 2185 Madrone Dr
- 2213 Madrone Dr
- 2933 Vista Grande
- 2179 Madrone Dr
- 2957 Vista Grande
- 2174 Madrone Dr
- 2210 Madrone Dr
- 2927 Vista Grande
- 2219 Madrone Dr
- 2963 Vista Grande
- 2216 Madrone Dr
- 2938 Vista Grande
- 2141 Calaveras Ct
Your Personal Tour Guide
Ask me questions while you tour the home.