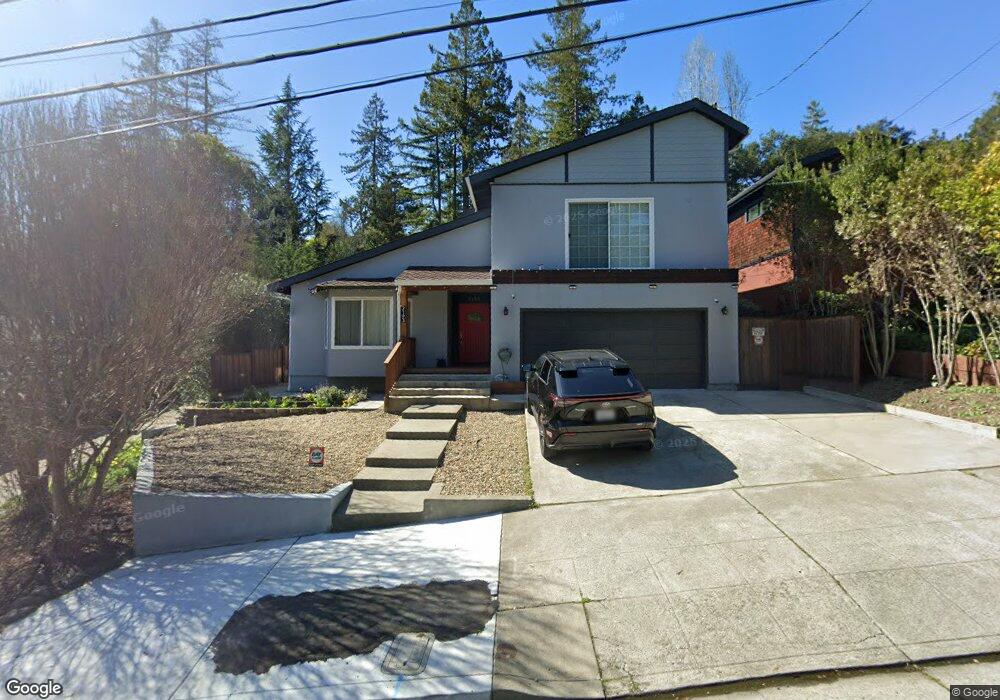
2193 Trafalgar Place Oakland, CA 94611
Montclair NeighborhoodEstimated Value: $1,417,000 - $2,116,000
4
Beds
3
Baths
2,835
Sq Ft
$576/Sq Ft
Est. Value
About This Home
This home is located at 2193 Trafalgar Place, Oakland, CA 94611 and is currently estimated at $1,632,353, approximately $575 per square foot. 2193 Trafalgar Place is a home located in Alameda County with nearby schools including Montclair Elementary School, Montera Middle School, and Skyline High School.
Ownership History
Date
Name
Owned For
Owner Type
Purchase Details
Closed on
Dec 8, 2005
Sold by
Coyle John and Coyle Antoinette M
Bought by
Coyle John and Coyle Antoinette
Current Estimated Value
Purchase Details
Closed on
Dec 17, 1998
Sold by
Pacific American Property Exchange Corp
Bought by
Coyle John and Coyle Antoinette
Purchase Details
Closed on
Nov 12, 1997
Sold by
Nguyen Sang T
Bought by
Coyle John and Coyle Antoinette M
Home Financials for this Owner
Home Financials are based on the most recent Mortgage that was taken out on this home.
Original Mortgage
$296,000
Interest Rate
7.3%
Purchase Details
Closed on
Mar 18, 1994
Sold by
Citizens Federal Bank
Bought by
Vo Michael Trieu Ba and Nguyen Sang Thi
Home Financials for this Owner
Home Financials are based on the most recent Mortgage that was taken out on this home.
Original Mortgage
$248,800
Interest Rate
7.59%
Purchase Details
Closed on
Dec 15, 1993
Sold by
Coast Fed Services
Bought by
Citizens Federal Bank
Create a Home Valuation Report for This Property
The Home Valuation Report is an in-depth analysis detailing your home's value as well as a comparison with similar homes in the area
Home Values in the Area
Average Home Value in this Area
Purchase History
| Date | Buyer | Sale Price | Title Company |
|---|---|---|---|
| Coyle John | -- | -- | |
| Coyle John | $132,500 | First American Title Guarant | |
| Coyle John | $370,000 | Placer Title Company | |
| Vo Michael Trieu Ba | $311,000 | Northwestern Title Co | |
| Citizens Federal Bank | $245,000 | Fidelity National Title Ins |
Source: Public Records
Mortgage History
| Date | Status | Borrower | Loan Amount |
|---|---|---|---|
| Previous Owner | Coyle John | $296,000 | |
| Previous Owner | Vo Michael Trieu Ba | $248,800 |
Source: Public Records
Tax History Compared to Growth
Tax History
| Year | Tax Paid | Tax Assessment Tax Assessment Total Assessment is a certain percentage of the fair market value that is determined by local assessors to be the total taxable value of land and additions on the property. | Land | Improvement |
|---|---|---|---|---|
| 2025 | $9,141 | $583,767 | $177,230 | $413,537 |
| 2024 | $9,141 | $572,186 | $173,756 | $405,430 |
| 2023 | $9,569 | $567,831 | $170,349 | $397,482 |
| 2022 | $9,307 | $549,697 | $167,009 | $389,688 |
| 2021 | $8,886 | $538,782 | $163,734 | $382,048 |
| 2020 | $8,786 | $540,188 | $162,056 | $378,132 |
| 2019 | $8,448 | $529,598 | $158,879 | $370,719 |
| 2018 | $8,107 | $519,217 | $155,765 | $363,452 |
| 2017 | $7,949 | $509,038 | $152,711 | $356,327 |
| 2016 | $7,679 | $499,058 | $149,717 | $349,341 |
| 2015 | $7,635 | $491,563 | $147,469 | $344,094 |
| 2014 | $7,672 | $481,935 | $144,580 | $337,355 |
Source: Public Records
Map
Nearby Homes
- 389 Somerset Rd
- 0 Scout Rd Unit 41056305
- 535 Hampton Rd
- 5969 Bruns Ct
- 2066 Drake Dr
- 21 Tyson Cir
- 5821 Bagshotte Dr
- 0 Bullard Dr
- 0 Girvin Dr Unit ML82023277
- 0 Girvin Dr Unit 41112543
- 0 Girvin Dr Unit 425033606
- 2593 El Caminito
- 5855 Chelton Dr
- 1 Sotelo Ave
- 6425 Zinn Dr
- 52 Glen Alpine Rd
- 2025 Braemar Rd
- 5958 Colton Blvd
- 45 Glen Alpine Rd
- 5601 Castle Dr
- 2189 Trafalgar Place
- 2229 Trafalgar Place
- 2197 Trafalgar Place
- 2185 Trafalgar Place
- 2233 Trafalgar Place
- 2181 Trafalgar Place
- 2231 Trafalgar Place
- 2237 Trafalgar Place
- 6700 Sims Dr
- 2177 Trafalgar Place
- 6684 Sims Dr
- 6710 Sims Dr
- 6722 Sims Dr
- 2173 Trafalgar Place
- 6666 Sims Dr
- 6672 Sims Dr
- 2167 Trafalgar Place
- 6660 Sims Dr
- 2161 Trafalgar Place
- 2210 Mountain Blvd