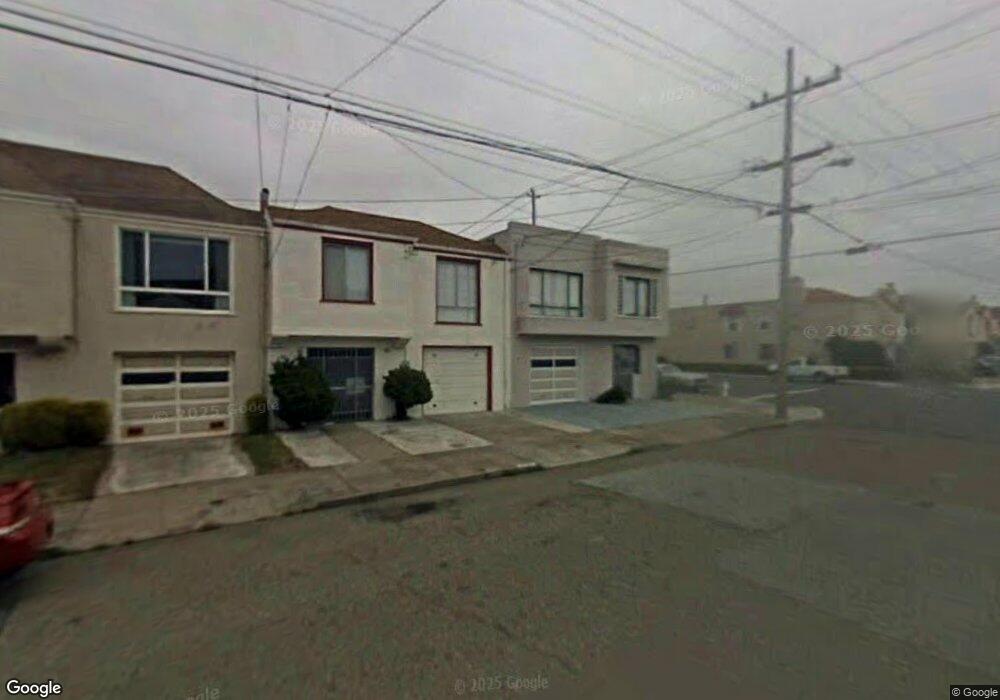
2194 34th Ave San Francisco, CA 94116
Parkside NeighborhoodEstimated Value: $1,379,000 - $1,652,000
3
Beds
3
Baths
2,124
Sq Ft
$713/Sq Ft
Est. Value
About This Home
This home is located at 2194 34th Ave, San Francisco, CA 94116 and is currently estimated at $1,515,438, approximately $713 per square foot. 2194 34th Ave is a home located in San Francisco County with nearby schools including Stevenson (Robert Louis) Elementary School, Giannini (A.P.) Middle School, and St. Gabriel School.
Ownership History
Date
Name
Owned For
Owner Type
Purchase Details
Closed on
Feb 2, 2021
Sold by
Hoo Leona Soo
Bought by
Leona Soo Hoo Revocable Trust and Hoo
Current Estimated Value
Purchase Details
Closed on
Jan 28, 2021
Sold by
Fishler Diana May and Leona Soo Hoo Revocable Trust
Bought by
Soohoo Cynthia June and Hoo Raymond Soo
Purchase Details
Closed on
Jan 26, 2021
Sold by
Soohoo Cynthia June and Fishler Diana May
Bought by
Soohoo Cynthia June and Fishler Diana May
Purchase Details
Closed on
Jun 27, 1996
Sold by
Leona Soo Hoo
Bought by
Hoo Leona Soo
Create a Home Valuation Report for This Property
The Home Valuation Report is an in-depth analysis detailing your home's value as well as a comparison with similar homes in the area
Home Values in the Area
Average Home Value in this Area
Purchase History
| Date | Buyer | Sale Price | Title Company |
|---|---|---|---|
| Leona Soo Hoo Revocable Trust | -- | -- | |
| Soohoo Cynthia June | -- | None Listed On Document | |
| Soohoo Cynthia June | -- | None Listed On Document | |
| Hoo Leona Soo | -- | -- |
Source: Public Records
Tax History Compared to Growth
Tax History
| Year | Tax Paid | Tax Assessment Tax Assessment Total Assessment is a certain percentage of the fair market value that is determined by local assessors to be the total taxable value of land and additions on the property. | Land | Improvement |
|---|---|---|---|---|
| 2025 | $4,616 | $340,315 | $111,657 | $228,658 |
| 2024 | $4,616 | $333,646 | $109,470 | $224,176 |
| 2023 | $4,618 | $327,106 | $107,325 | $219,781 |
| 2022 | $4,516 | $320,695 | $105,222 | $215,473 |
| 2021 | $3,747 | $314,486 | $103,190 | $211,296 |
| 2020 | $3,757 | $311,262 | $102,132 | $209,130 |
| 2019 | $3,630 | $305,160 | $100,130 | $205,030 |
| 2018 | $3,509 | $299,177 | $98,167 | $201,010 |
| 2017 | $3,467 | $293,312 | $96,243 | $197,069 |
| 2016 | $3,387 | $287,561 | $94,356 | $193,205 |
| 2015 | $3,346 | $283,242 | $92,939 | $190,303 |
| 2014 | $3,258 | $277,695 | $91,119 | $186,576 |
Source: Public Records
Map
Nearby Homes