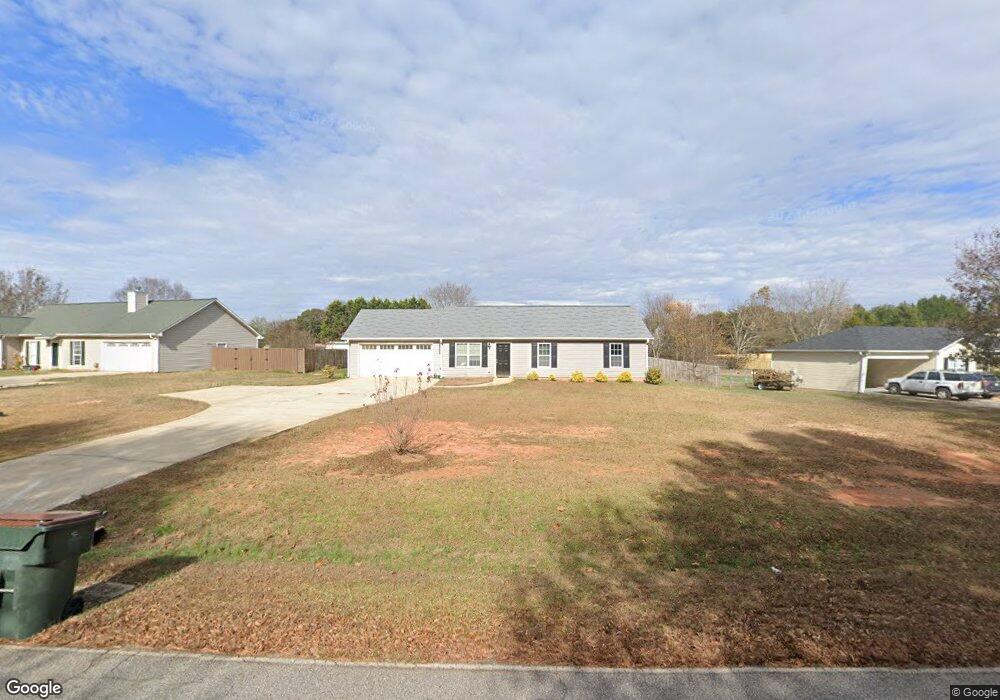
2194 Broad St Statham, GA 30666
Estimated Value: $290,000 - $345,000
3
Beds
2
Baths
1,218
Sq Ft
$259/Sq Ft
Est. Value
About This Home
This home is located at 2194 Broad St, Statham, GA 30666 and is currently estimated at $315,435, approximately $258 per square foot. 2194 Broad St is a home located in Barrow County with nearby schools including Statham Elementary School, Bear Creek Middle School, and Winder-Barrow High School.
Ownership History
Date
Name
Owned For
Owner Type
Purchase Details
Closed on
Mar 5, 2021
Sold by
Crowe Bobby Jack
Bought by
Finney David J and Moncrief Joan
Current Estimated Value
Home Financials for this Owner
Home Financials are based on the most recent Mortgage that was taken out on this home.
Original Mortgage
$216,600
Outstanding Balance
$194,167
Interest Rate
2.7%
Mortgage Type
New Conventional
Estimated Equity
$121,268
Purchase Details
Closed on
Oct 15, 2020
Sold by
Tipton Sandra
Bought by
Crowe Bobby Jack
Purchase Details
Closed on
Aug 7, 2006
Sold by
Grizzle Lewis H
Bought by
Tipton Derrick and Tipton Sandra
Home Financials for this Owner
Home Financials are based on the most recent Mortgage that was taken out on this home.
Original Mortgage
$109,335
Interest Rate
6.67%
Mortgage Type
FHA
Purchase Details
Closed on
Sep 29, 1998
Sold by
W T'S Drywall Compan
Bought by
W T'S Home Builders
Purchase Details
Closed on
Feb 23, 1996
Bought by
W T'S Drywall Compan
Create a Home Valuation Report for This Property
The Home Valuation Report is an in-depth analysis detailing your home's value as well as a comparison with similar homes in the area
Home Values in the Area
Average Home Value in this Area
Purchase History
| Date | Buyer | Sale Price | Title Company |
|---|---|---|---|
| Finney David J | $228,000 | -- | |
| Crowe Bobby Jack | $110,000 | -- | |
| Tipton Derrick | $110,200 | -- | |
| W T'S Home Builders | $15,000 | -- | |
| W T'S Drywall Compan | -- | -- |
Source: Public Records
Mortgage History
| Date | Status | Borrower | Loan Amount |
|---|---|---|---|
| Open | Finney David J | $216,600 | |
| Previous Owner | Tipton Derrick | $109,335 |
Source: Public Records
Tax History Compared to Growth
Tax History
| Year | Tax Paid | Tax Assessment Tax Assessment Total Assessment is a certain percentage of the fair market value that is determined by local assessors to be the total taxable value of land and additions on the property. | Land | Improvement |
|---|---|---|---|---|
| 2024 | $3,282 | $110,235 | $22,000 | $88,235 |
| 2023 | $2,831 | $110,235 | $22,000 | $88,235 |
| 2022 | $2,554 | $86,364 | $18,600 | $67,764 |
| 2021 | $1,394 | $70,061 | $8,000 | $62,061 |
| 2020 | $1,029 | $36,188 | $8,000 | $28,188 |
| 2019 | $1,043 | $36,188 | $8,000 | $28,188 |
| 2018 | $1,037 | $36,188 | $8,000 | $28,188 |
| 2017 | $1,112 | $31,872 | $8,000 | $23,872 |
| 2016 | $896 | $32,438 | $8,000 | $24,438 |
| 2015 | $907 | $32,721 | $8,000 | $24,721 |
| 2014 | $791 | $30,492 | $5,488 | $25,004 |
| 2013 | -- | $29,032 | $5,488 | $23,544 |
Source: Public Records
Map
Nearby Homes
- 2198 Broad St
- 2190 Broad St Unit 1
- 2204 Broad St
- 2186 Broad St
- 531 Reynolds Ct
- 0 Reynolds Ct Unit 3187590
- 0 Reynolds Ct Unit 3141353
- 0 Reynolds Ct
- 2230 Glenn Jackson Rd Unit 1
- 2182 Broad St Unit 1
- 529 Reynolds Ct
- 529 Reynolds Ct Unit 18
- 2217 Glenn Jackson Rd
- 2213 Glenn Jackson Rd
- 2176 Broad St Unit 1
- 2234 Glenn Jackson Rd
- 527 Reynolds Ct Unit 2
- 530 Reynolds Ct
- 535 Reynolds Ct Unit 2
- 2170 Broad St Unit 1