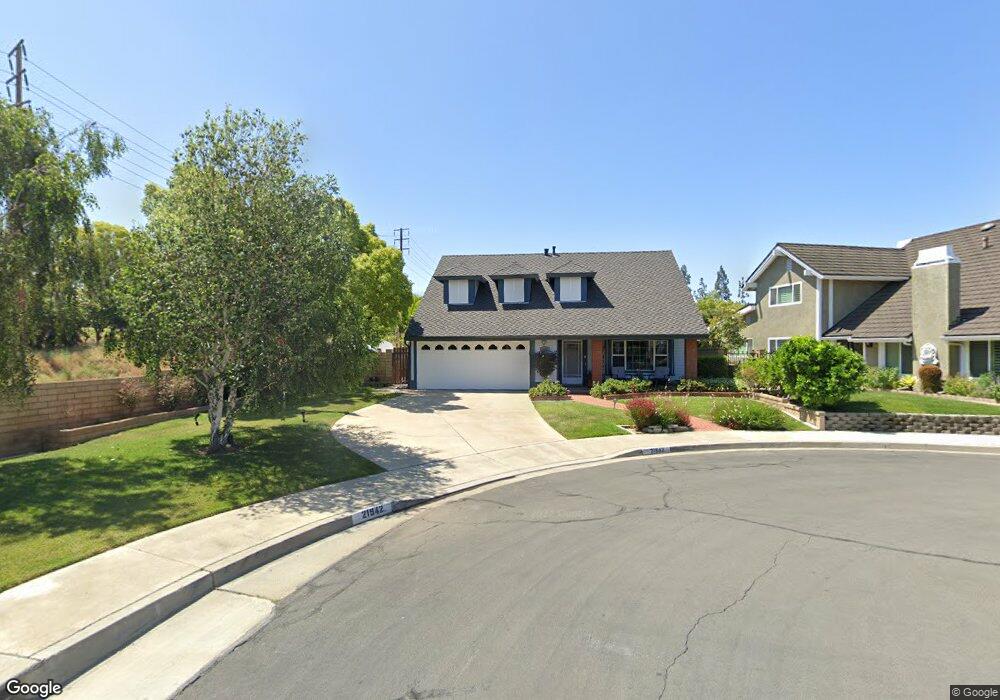
21942 Sagebrush Cir Lake Forest, CA 92630
Estimated Value: $1,329,000 - $1,398,000
5
Beds
3
Baths
2,450
Sq Ft
$556/Sq Ft
Est. Value
About This Home
This home is located at 21942 Sagebrush Cir, Lake Forest, CA 92630 and is currently estimated at $1,361,722, approximately $555 per square foot. 21942 Sagebrush Cir is a home located in Orange County with nearby schools including La Madera Elementary School, Serrano Intermediate School, and El Toro High School.
Ownership History
Date
Name
Owned For
Owner Type
Purchase Details
Closed on
Dec 11, 2020
Sold by
Welch Michael F and Welch Theresa C
Bought by
Welch Michael F and Welch Theresa C
Current Estimated Value
Home Financials for this Owner
Home Financials are based on the most recent Mortgage that was taken out on this home.
Original Mortgage
$675,000
Interest Rate
2.7%
Mortgage Type
New Conventional
Purchase Details
Closed on
Dec 2, 2016
Sold by
Welch Michael F and Welch Theresa C
Bought by
Welch Michael F and Welch Theresa C
Home Financials for this Owner
Home Financials are based on the most recent Mortgage that was taken out on this home.
Original Mortgage
$615,000
Interest Rate
3.47%
Mortgage Type
New Conventional
Purchase Details
Closed on
Apr 3, 2006
Sold by
Welch Michael and Welch Theresa
Bought by
Michael F & Theresa C Welch Trust
Create a Home Valuation Report for This Property
The Home Valuation Report is an in-depth analysis detailing your home's value as well as a comparison with similar homes in the area
Home Values in the Area
Average Home Value in this Area
Purchase History
| Date | Buyer | Sale Price | Title Company |
|---|---|---|---|
| Welch Michael F | -- | Accommodation | |
| Welch Michael F | -- | Fidelity Natl Ttl Orange Cnt | |
| Welch Michael F | -- | Accommodation | |
| Welch Michael F | -- | Bnt Title Company Of Ca | |
| Michael F & Theresa C Welch Trust | -- | None Available |
Source: Public Records
Mortgage History
| Date | Status | Borrower | Loan Amount |
|---|---|---|---|
| Closed | Welch Michael F | $675,000 | |
| Closed | Welch Michael F | $615,000 |
Source: Public Records
Tax History Compared to Growth
Tax History
| Year | Tax Paid | Tax Assessment Tax Assessment Total Assessment is a certain percentage of the fair market value that is determined by local assessors to be the total taxable value of land and additions on the property. | Land | Improvement |
|---|---|---|---|---|
| 2025 | $4,114 | $408,721 | $164,760 | $243,961 |
| 2024 | $4,114 | $400,707 | $161,529 | $239,178 |
| 2023 | $4,015 | $392,850 | $158,361 | $234,489 |
| 2022 | $3,943 | $385,148 | $155,256 | $229,892 |
| 2021 | $3,863 | $377,597 | $152,212 | $225,385 |
| 2020 | $3,828 | $373,726 | $150,652 | $223,074 |
| 2019 | $3,750 | $366,399 | $147,699 | $218,700 |
| 2018 | $3,679 | $359,215 | $144,803 | $214,412 |
| 2017 | $3,604 | $352,172 | $141,964 | $210,208 |
| 2016 | $3,543 | $345,267 | $139,180 | $206,087 |
| 2015 | $3,499 | $340,081 | $137,089 | $202,992 |
| 2014 | $3,422 | $333,420 | $134,404 | $199,016 |
Source: Public Records
Map
Nearby Homes
- 25495 Morningstar Rd
- 25671 Le Parc Unit 85
- 25671 Le Parc Unit 82
- 25631 Mont Pointe Unit 7D
- 25761 Le Parc Unit 82
- 25761 Le Parc Unit 89
- 25712 Le Parc Unit 7
- 25614 Mont Pointe Unit 3D
- 25644 Mont Pointe Unit 1A
- 22201 Center Pointe Unit 2D
- 22461 Silver Spur
- 25912 Densmore Dr
- 25154 Mammoth Cir
- 25152 Mammoth Cir
- 25885 Trabuco Rd Unit 206
- 25885 Trabuco Rd Unit 91
- 25885 Trabuco Rd Unit 306
- 25885 Trabuco Rd Unit 33
- 25885 Trabuco Rd Unit 226
- 25885 Trabuco Rd Unit 271
- 21946 Sagebrush Cir
- 21952 Sagebrush Cir
- 25491 Morningstar Rd
- 21941 Sagebrush Cir
- 21962 Sagebrush Cir
- 21943 Sagebrush Cir
- 21945 Sagebrush Cir
- 21951 Sagebrush Cir
- 21955 Sagebrush Cir
- 25484 Morningstar Rd
- 25486 Morningstar Rd
- 25482 Morningstar Rd
- 21896 Red River Dr
- 25476 Morningstar Rd
- 21892 Red River Dr
- 25474 Morningstar Rd
- 25494 Morningstar Rd
- 21882 Red River Dr
- 25472 Morningstar Rd