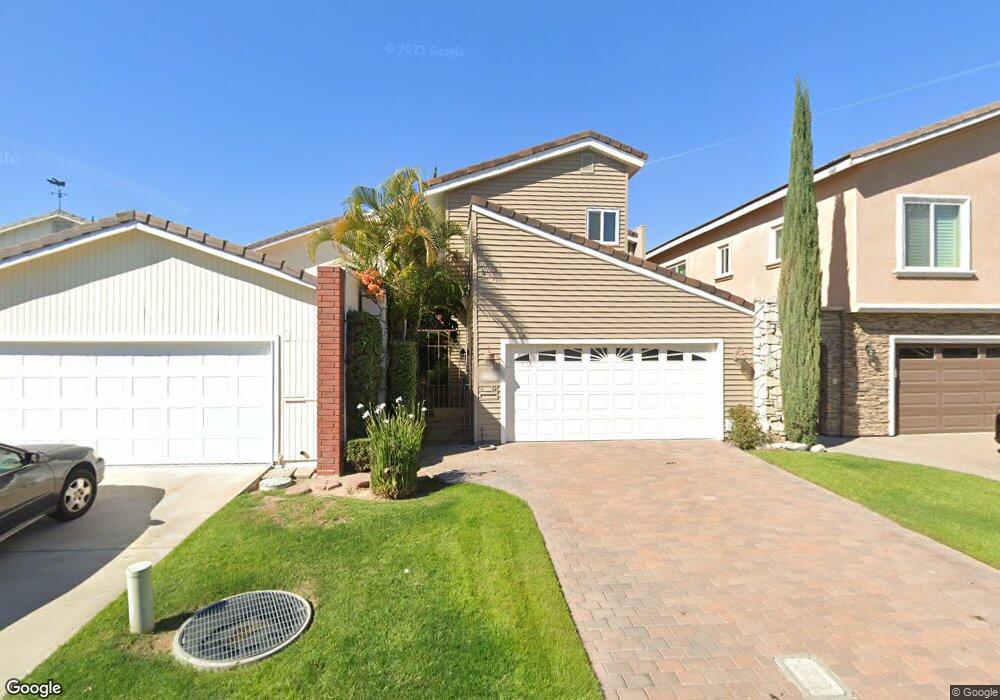
21949 Yellowstone Ln Lake Forest, CA 92630
Estimated Value: $1,518,452 - $2,306,000
3
Beds
3
Baths
2,472
Sq Ft
$793/Sq Ft
Est. Value
About This Home
This home is located at 21949 Yellowstone Ln, Lake Forest, CA 92630 and is currently estimated at $1,959,113, approximately $792 per square foot. 21949 Yellowstone Ln is a home located in Orange County with nearby schools including Rancho Canada Elementary School, Serrano Intermediate School, and El Toro High School.
Ownership History
Date
Name
Owned For
Owner Type
Purchase Details
Closed on
Apr 30, 2001
Sold by
Ebbing Michael L and Ebbing Karen S
Bought by
Ebbing Michael L and Ebbing Karen S
Current Estimated Value
Home Financials for this Owner
Home Financials are based on the most recent Mortgage that was taken out on this home.
Original Mortgage
$275,000
Interest Rate
7.09%
Purchase Details
Closed on
Apr 20, 2000
Sold by
Philo Walker and Philo Deanna
Bought by
Ebbing Michael L and Ebbing Karen S
Home Financials for this Owner
Home Financials are based on the most recent Mortgage that was taken out on this home.
Original Mortgage
$300,000
Interest Rate
8%
Purchase Details
Closed on
Jul 12, 1996
Sold by
Abbott Nancy
Bought by
Walker Philo B and Walker Deanna L
Home Financials for this Owner
Home Financials are based on the most recent Mortgage that was taken out on this home.
Original Mortgage
$236,000
Interest Rate
4.95%
Create a Home Valuation Report for This Property
The Home Valuation Report is an in-depth analysis detailing your home's value as well as a comparison with similar homes in the area
Home Values in the Area
Average Home Value in this Area
Purchase History
| Date | Buyer | Sale Price | Title Company |
|---|---|---|---|
| Ebbing Michael L | -- | First American Title Ins Co | |
| Ebbing Michael L | $565,000 | First American Title Ins Co | |
| Walker Philo B | $295,000 | South Coast Title Company |
Source: Public Records
Mortgage History
| Date | Status | Borrower | Loan Amount |
|---|---|---|---|
| Closed | Ebbing Michael L | $275,000 | |
| Previous Owner | Ebbing Michael L | $300,000 | |
| Previous Owner | Walker Philo B | $236,000 |
Source: Public Records
Tax History
| Year | Tax Paid | Tax Assessment Tax Assessment Total Assessment is a certain percentage of the fair market value that is determined by local assessors to be the total taxable value of land and additions on the property. | Land | Improvement |
|---|---|---|---|---|
| 2025 | $8,886 | $868,390 | $672,083 | $196,307 |
| 2024 | $8,886 | $851,363 | $658,905 | $192,458 |
| 2023 | $8,676 | $834,670 | $645,985 | $188,685 |
| 2022 | $8,520 | $818,304 | $633,318 | $184,986 |
| 2021 | $8,349 | $802,259 | $620,900 | $181,359 |
| 2020 | $8,273 | $794,033 | $614,533 | $179,500 |
| 2019 | $8,107 | $778,464 | $602,483 | $175,981 |
| 2018 | $7,954 | $763,200 | $590,669 | $172,531 |
| 2017 | $7,794 | $748,236 | $579,087 | $169,149 |
| 2016 | $7,664 | $733,565 | $567,732 | $165,833 |
| 2015 | $7,570 | $722,547 | $559,204 | $163,343 |
| 2014 | $7,406 | $708,394 | $548,250 | $160,144 |
Source: Public Records
Map
Nearby Homes
- 21886 Winnebago Ln
- 24662 Toledo Ln
- 21961 Cayuga Ln
- 21922 Erie Ln
- 21778 Tahoe Ln
- 24596 Donna Ln
- 22235 Vista Verde Dr
- 24342 Cardinal Place
- 24882 Timberwood Way
- 24931 Timberwood Way
- 24231 Sparrow St
- 25011 Mammoth Cir
- 24222 Ontario Ln
- 24751 Woodhill Ln
- 24691 Shadowfax Dr
- 25152 Mammoth Cir
- 24562 Via Tonada
- 24001 Muirlands Blvd Unit 31
- 24001 Muirlands Blvd Unit 12
- 24001 Muirlands Blvd Unit 352
- 21951 Yellowstone Ln
- 21947 Yellowstone Ln
- 21945 Yellowstone Ln
- 21959 Yellowstone Ln
- 21961 Yellowstone Ln
- 21941 Yellowstone Ln
- 21963 Yellowstone Ln
- 21937 Yellowstone Ln
- 21965 Yellowstone Ln
- 21927 Yellowstone Ln
- 21986 Yellowstone Ln
- 21921 Yellowstone Ln
- 21982 Yellowstone Ln
- 21976 Yellowstone Ln
- 21917 Yellowstone Ln
- 21908 Winnebago Ln
- 21896 Winnebago Ln
- 21952 Yellowstone Ln
- 21956 Yellowstone Ln
- 21912 Winnebago Ln
Your Personal Tour Guide
Ask me questions while you tour the home.