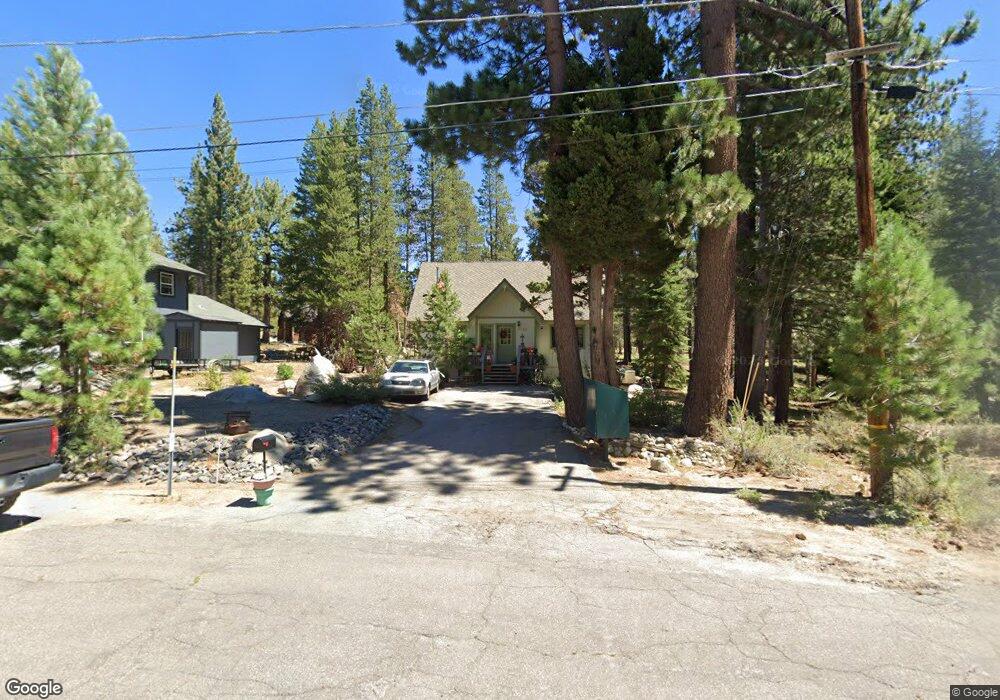
2195 Minal St South Lake Tahoe, CA 96150
Estimated Value: $569,595 - $599,000
3
Beds
2
Baths
1,410
Sq Ft
$416/Sq Ft
Est. Value
About This Home
This home is located at 2195 Minal St, South Lake Tahoe, CA 96150 and is currently estimated at $586,899, approximately $416 per square foot. 2195 Minal St is a home located in El Dorado County with nearby schools including Tahoe Valley Elementary School, South Tahoe Middle School, and South Tahoe High School.
Ownership History
Date
Name
Owned For
Owner Type
Purchase Details
Closed on
Nov 17, 2000
Sold by
Bosson Donald W and Bosson Janice M
Bought by
Bosson Donald W and Bosson Janice M
Current Estimated Value
Purchase Details
Closed on
Mar 30, 1999
Sold by
Chodosh Robyn
Bought by
Bosson Donald W and Bosson Janice M
Home Financials for this Owner
Home Financials are based on the most recent Mortgage that was taken out on this home.
Original Mortgage
$81,600
Outstanding Balance
$20,233
Interest Rate
6.79%
Estimated Equity
$566,666
Purchase Details
Closed on
Sep 24, 1998
Sold by
Engebregson Brad D
Bought by
Chodosh Robyn
Purchase Details
Closed on
Apr 27, 1998
Sold by
Chodosh Robyn and Engebregson Robyn
Bought by
Engebregson Brad D
Home Financials for this Owner
Home Financials are based on the most recent Mortgage that was taken out on this home.
Original Mortgage
$25,290
Interest Rate
7.06%
Mortgage Type
Seller Take Back
Create a Home Valuation Report for This Property
The Home Valuation Report is an in-depth analysis detailing your home's value as well as a comparison with similar homes in the area
Home Values in the Area
Average Home Value in this Area
Purchase History
| Date | Buyer | Sale Price | Title Company |
|---|---|---|---|
| Bosson Donald W | -- | -- | |
| Bosson Donald W | $102,000 | Old Republic Title Company | |
| Chodosh Robyn | $16,234 | Placer Title Co | |
| Engebregson Brad D | -- | -- |
Source: Public Records
Mortgage History
| Date | Status | Borrower | Loan Amount |
|---|---|---|---|
| Open | Bosson Donald W | $81,600 | |
| Previous Owner | Engebregson Brad D | $25,290 |
Source: Public Records
Tax History Compared to Growth
Tax History
| Year | Tax Paid | Tax Assessment Tax Assessment Total Assessment is a certain percentage of the fair market value that is determined by local assessors to be the total taxable value of land and additions on the property. | Land | Improvement |
|---|---|---|---|---|
| 2025 | $1,781 | $159,874 | $39,180 | $120,694 |
| 2024 | $1,781 | $156,740 | $38,412 | $118,328 |
| 2023 | $1,751 | $153,667 | $37,659 | $116,008 |
| 2022 | $1,735 | $150,655 | $36,921 | $113,734 |
| 2021 | $1,706 | $147,702 | $36,198 | $111,504 |
| 2020 | $1,685 | $146,188 | $35,827 | $110,361 |
| 2019 | $1,677 | $143,323 | $35,125 | $108,198 |
| 2018 | $1,641 | $140,514 | $34,437 | $106,077 |
| 2017 | $1,616 | $137,760 | $33,762 | $103,998 |
| 2016 | $1,585 | $135,059 | $33,100 | $101,959 |
| 2015 | $1,507 | $133,032 | $32,603 | $100,429 |
| 2014 | $1,507 | $130,428 | $31,965 | $98,463 |
Source: Public Records
Map
Nearby Homes
- 2255 Blitzen Rd
- 2263 Blitzen Rd
- 2189 Cornelian Dr
- 2182 Lindenwood Dr
- 1085 Mulberry Dr
- 2181 Pinewood Dr
- 968 Shakori Dr
- 972 Shakori Dr
- 2311 Chiapa Dr
- 2113 Oaxaco St
- 2610 Henderson St
- 902 Kekin St
- 859 Kekin St
- 938 Kekin St
- 2001 Washoe St
- 2510 Blitzen Rd
- 980 Kekin St
- 1982 Cherokee St
- 1502 Seminole Dr
- 1140 Sioux St