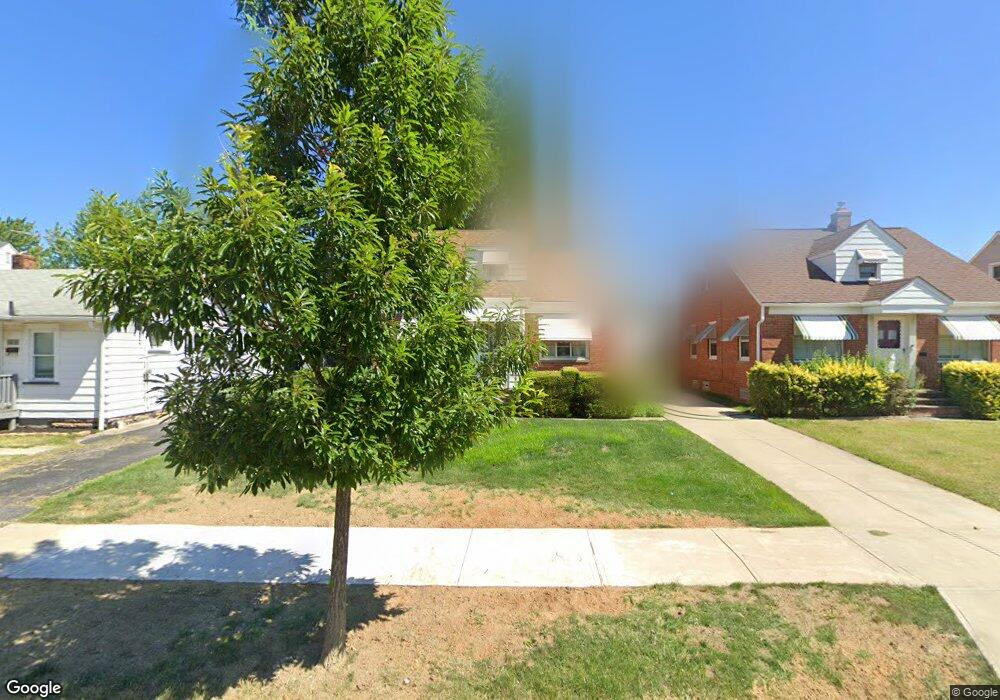
21951 Tracy Ave Euclid, OH 44123
Estimated Value: $125,000 - $141,000
3
Beds
1
Bath
1,233
Sq Ft
$106/Sq Ft
Est. Value
About This Home
This home is located at 21951 Tracy Ave, Euclid, OH 44123 and is currently estimated at $130,617, approximately $105 per square foot. 21951 Tracy Ave is a home located in Cuyahoga County with nearby schools including Arbor Elementary School, Euclid Middle School, and Euclid High School.
Ownership History
Date
Name
Owned For
Owner Type
Purchase Details
Closed on
Dec 14, 1999
Sold by
Taylor John D
Bought by
Pettegrew Robert C
Current Estimated Value
Home Financials for this Owner
Home Financials are based on the most recent Mortgage that was taken out on this home.
Original Mortgage
$77,350
Interest Rate
7.87%
Purchase Details
Closed on
Oct 15, 1986
Sold by
Bennett Patricia
Bought by
Taylor John D
Purchase Details
Closed on
Feb 4, 1977
Sold by
Young Wilfrid J and Young Lena R
Bought by
Bennett Patricia
Purchase Details
Closed on
Jan 1, 1975
Bought by
Young Wilfrid J and Young Lena R
Create a Home Valuation Report for This Property
The Home Valuation Report is an in-depth analysis detailing your home's value as well as a comparison with similar homes in the area
Home Values in the Area
Average Home Value in this Area
Purchase History
| Date | Buyer | Sale Price | Title Company |
|---|---|---|---|
| Pettegrew Robert C | $68,500 | Tower City Title Agency Inc | |
| Taylor John D | $58,500 | -- | |
| Bennett Patricia | $38,000 | -- | |
| Young Wilfrid J | -- | -- |
Source: Public Records
Mortgage History
| Date | Status | Borrower | Loan Amount |
|---|---|---|---|
| Closed | Pettegrew Robert C | $77,350 |
Source: Public Records
Tax History Compared to Growth
Tax History
| Year | Tax Paid | Tax Assessment Tax Assessment Total Assessment is a certain percentage of the fair market value that is determined by local assessors to be the total taxable value of land and additions on the property. | Land | Improvement |
|---|---|---|---|---|
| 2024 | $2,346 | $44,380 | $7,875 | $36,505 |
| 2023 | $1,502 | $26,470 | $6,200 | $20,270 |
| 2022 | $1,501 | $26,460 | $6,200 | $20,270 |
| 2021 | $1,666 | $26,460 | $6,200 | $20,270 |
| 2020 | $1,193 | $20,060 | $4,690 | $15,370 |
| 2019 | $1,084 | $57,300 | $13,400 | $43,900 |
| 2018 | $1,017 | $20,060 | $4,690 | $15,370 |
| 2017 | $992 | $17,230 | $3,120 | $14,110 |
| 2016 | $994 | $17,230 | $3,120 | $14,110 |
| 2015 | $931 | $17,230 | $3,120 | $14,110 |
| 2014 | $931 | $17,230 | $3,120 | $14,110 |
Source: Public Records
Map
Nearby Homes
- 21670 Wilmore Ave
- 21700 Westport Ave
- 21331 Morris Ave
- 21570 Ball Ave
- 21451 Arbor Ave
- 21170 Wilmore Ave
- 21481 Ball Ave
- 21051 Nicholas Ave
- 21181 Ball Ave
- 23050 Tracy Ave
- 841 E 216th St
- 21051 Westport Ave
- 934 E 223rd St
- 20830 Tracy Ave
- 21050 Fuller Ave
- 20921 Westport Ave
- 20800 Morris Ave
- 20801 Morris Ave
- 21030 Priday Ave
- 20760 Westport Ave
- 22001 Tracy Ave
- 21923 Tracy Ave
- 22031 Tracy Ave
- 21901 Tracy Ave
- 1071 Tracy Ave
- 21871 Tracy Ave
- 22051 Tracy Ave
- 21950 Morris Ave
- 21970 Morris Ave
- 21930 Morris Ave
- 22000 Morris Ave
- 21900 Morris Ave
- 22071 Tracy Ave
- 21851 Tracy Ave
- 22030 Morris Ave
- 21850 Morris Ave
- 22000 Tracy Ave
- 21950 Tracy Ave
- 22030 Tracy Ave
- 21900 Tracy Ave