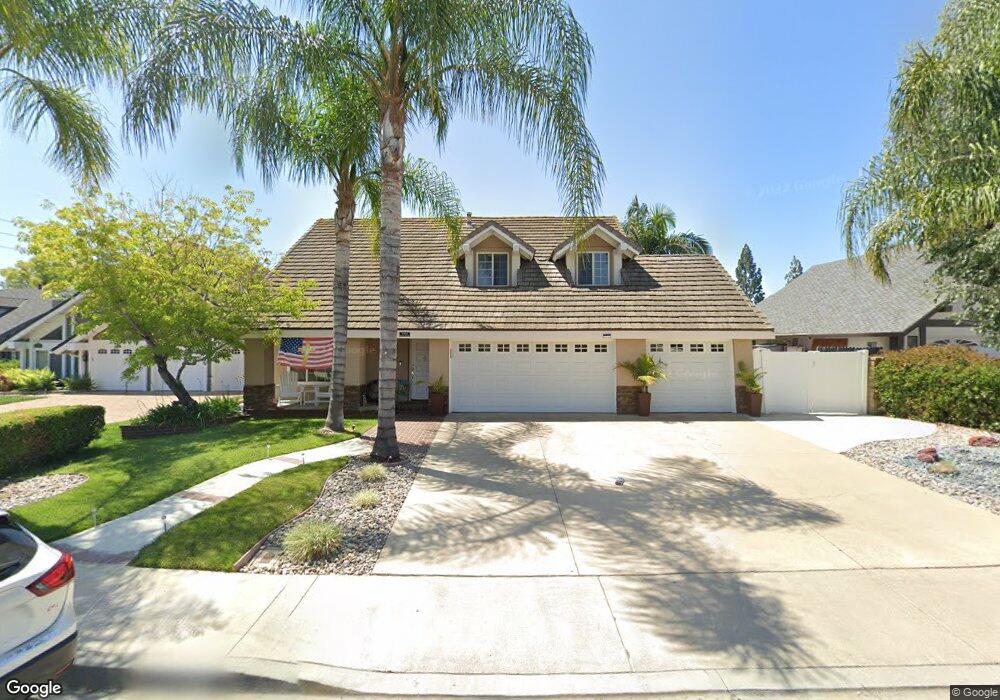
21952 Sagebrush Cir Lake Forest, CA 92630
Estimated Value: $1,202,689 - $1,317,000
4
Beds
3
Baths
2,149
Sq Ft
$588/Sq Ft
Est. Value
About This Home
This home is located at 21952 Sagebrush Cir, Lake Forest, CA 92630 and is currently estimated at $1,263,672, approximately $588 per square foot. 21952 Sagebrush Cir is a home located in Orange County with nearby schools including La Madera Elementary School, Serrano Intermediate School, and El Toro High School.
Ownership History
Date
Name
Owned For
Owner Type
Purchase Details
Closed on
Apr 30, 2020
Sold by
Baker Darren and Baker Lisa
Bought by
Baker Darren and Baker Lisa
Current Estimated Value
Purchase Details
Closed on
May 26, 2016
Sold by
Baker Darren M and Baker Lisa Kay
Bought by
Baker Darren and Baker Lisa
Home Financials for this Owner
Home Financials are based on the most recent Mortgage that was taken out on this home.
Original Mortgage
$319,000
Outstanding Balance
$254,054
Interest Rate
3.59%
Mortgage Type
New Conventional
Estimated Equity
$1,009,618
Purchase Details
Closed on
Jan 30, 1996
Sold by
Bank Of America Nt & Sa
Bought by
Baker Darren M and Baker Lisa Kay
Home Financials for this Owner
Home Financials are based on the most recent Mortgage that was taken out on this home.
Original Mortgage
$192,850
Interest Rate
7.1%
Purchase Details
Closed on
Oct 27, 1995
Sold by
Newberry Robert Mark and Newberry Kathleen Margaret
Bought by
Bank Of America Nt & Sa
Create a Home Valuation Report for This Property
The Home Valuation Report is an in-depth analysis detailing your home's value as well as a comparison with similar homes in the area
Home Values in the Area
Average Home Value in this Area
Purchase History
| Date | Buyer | Sale Price | Title Company |
|---|---|---|---|
| Baker Darren | -- | None Available | |
| Baker Darren | -- | Bnt Title Company Of Ca | |
| Baker Darren M | $203,000 | -- | |
| Bank Of America Nt & Sa | $188,000 | Orange Coast Title |
Source: Public Records
Mortgage History
| Date | Status | Borrower | Loan Amount |
|---|---|---|---|
| Open | Baker Darren | $319,000 | |
| Closed | Baker Darren M | $192,850 |
Source: Public Records
Tax History
| Year | Tax Paid | Tax Assessment Tax Assessment Total Assessment is a certain percentage of the fair market value that is determined by local assessors to be the total taxable value of land and additions on the property. | Land | Improvement |
|---|---|---|---|---|
| 2025 | $3,674 | $366,105 | $126,369 | $239,736 |
| 2024 | $3,674 | $358,927 | $123,891 | $235,036 |
| 2023 | $3,586 | $351,890 | $121,462 | $230,428 |
| 2022 | $3,521 | $344,991 | $119,081 | $225,910 |
| 2021 | $3,449 | $338,227 | $116,746 | $221,481 |
| 2020 | $3,418 | $334,759 | $115,549 | $219,210 |
| 2019 | $3,348 | $328,196 | $113,284 | $214,912 |
| 2018 | $3,284 | $321,761 | $111,062 | $210,699 |
| 2017 | $3,217 | $315,452 | $108,884 | $206,568 |
| 2016 | $3,163 | $309,267 | $106,749 | $202,518 |
| 2015 | $3,124 | $304,622 | $105,146 | $199,476 |
| 2014 | $3,054 | $298,655 | $103,086 | $195,569 |
Source: Public Records
Map
Nearby Homes
- 21851 Ute Way
- 25652 Rimgate Dr Unit 1D
- 25671 Le Parc Unit 8
- 25761 Le Parc
- 25761 Le Parc Unit 9
- 25761 Le Parc Unit 82
- 25631 Mont Pointe Unit 7D
- 22141 Comanche Rd
- 25712 Le Parc Unit 20
- 25712 Le Parc Unit 7
- 25712 Le Parc Unit 56
- 25712 Le Parc Unit 41
- 21981 Rimhurst Dr Unit 160
- 25614 Mont Pointe Unit 3D
- 21991 143 Rimhurst
- 21921 Rimhurst Dr Unit 130-G
- 25701 View Pointe Unit 8C
- 25728 View Pointe Unit 4G
- 21632 Treeline Ln
- 21621 Canada Rd
- 21962 Sagebrush Cir
- 21946 Sagebrush Cir
- 25485 Morningstar Rd
- 21942 Sagebrush Cir
- 25491 Morningstar Rd
- 21955 Sagebrush Cir
- 21951 Sagebrush Cir
- 21945 Sagebrush Cir
- 21943 Sagebrush Cir
- 25476 Morningstar Rd
- 25482 Morningstar Rd
- 25474 Morningstar Rd
- 21941 Sagebrush Cir
- 25484 Morningstar Rd
- 25472 Morningstar Rd
- 25486 Morningstar Rd
- 25466 Morningstar Rd
- 21902 Red River Dr
- 21896 Red River Dr
Your Personal Tour Guide
Ask me questions while you tour the home.