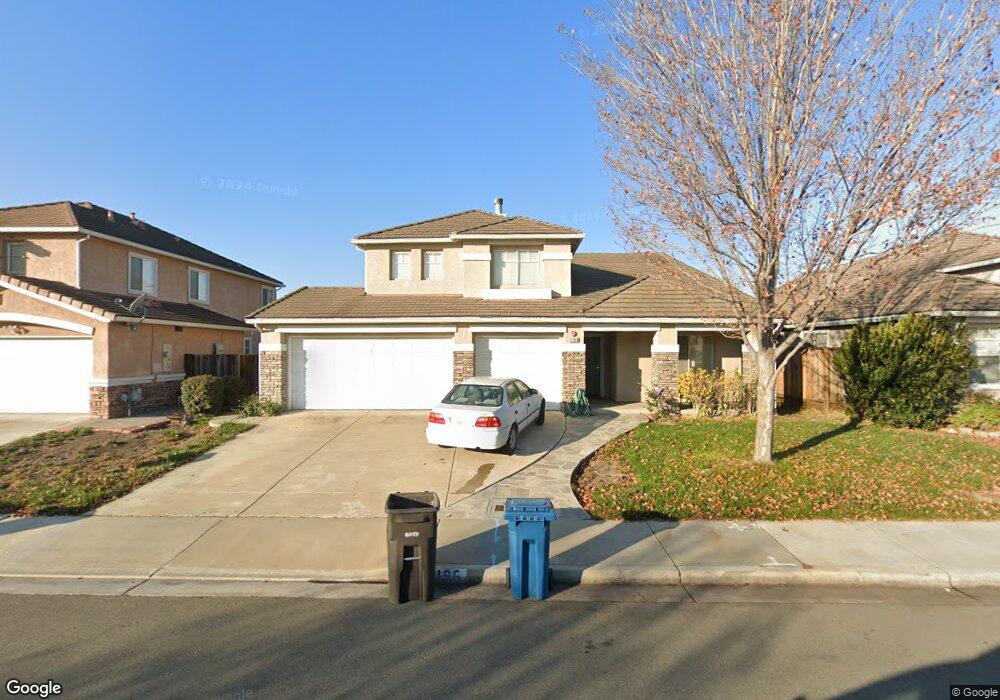
2196 Champlain Way Union City, CA 94587
Estimated Value: $1,761,000 - $1,859,021
4
Beds
3
Baths
2,568
Sq Ft
$709/Sq Ft
Est. Value
About This Home
This home is located at 2196 Champlain Way, Union City, CA 94587 and is currently estimated at $1,820,255, approximately $708 per square foot. 2196 Champlain Way is a home located in Alameda County with nearby schools including Tom Kitayama Elementary School, Cesar Chavez Middle School, and James Logan High School.
Ownership History
Date
Name
Owned For
Owner Type
Purchase Details
Closed on
Sep 7, 2016
Sold by
Runels Jeffrey Lamar and Liu Runels Patricia Sue
Bought by
Runeis Jeffrey Lamar and Liu Runels Patricia Sue
Current Estimated Value
Home Financials for this Owner
Home Financials are based on the most recent Mortgage that was taken out on this home.
Original Mortgage
$100,000
Outstanding Balance
$73,474
Interest Rate
3.43%
Mortgage Type
Credit Line Revolving
Estimated Equity
$1,746,782
Purchase Details
Closed on
Apr 12, 2010
Sold by
Runels Jeffrey Lamar and Liu Runels Patricia Sue
Bought by
Runels Jeffrey Lamar and Liu Runels Patricia Sue
Purchase Details
Closed on
Mar 4, 1998
Sold by
Kaufman & Broad South Bay Inc
Bought by
Runels Jeffrey Lamar and Liu Runels Patricia Sue
Home Financials for this Owner
Home Financials are based on the most recent Mortgage that was taken out on this home.
Original Mortgage
$317,450
Outstanding Balance
$58,074
Interest Rate
7.02%
Estimated Equity
$1,762,181
Create a Home Valuation Report for This Property
The Home Valuation Report is an in-depth analysis detailing your home's value as well as a comparison with similar homes in the area
Home Values in the Area
Average Home Value in this Area
Purchase History
| Date | Buyer | Sale Price | Title Company |
|---|---|---|---|
| Runeis Jeffrey Lamar | -- | Old Republic Title Company | |
| Runels Jeffrey Lamar | -- | Old Republic Title Company | |
| Runels Jeffrey Lamar | -- | None Available | |
| Runels Jeffrey Lamar | $397,000 | First American Title Guarant |
Source: Public Records
Mortgage History
| Date | Status | Borrower | Loan Amount |
|---|---|---|---|
| Open | Runels Jeffrey Lamar | $100,000 | |
| Open | Runels Jeffrey Lamar | $317,450 | |
| Closed | Runels Jeffrey Lamar | $39,650 |
Source: Public Records
Tax History
| Year | Tax Paid | Tax Assessment Tax Assessment Total Assessment is a certain percentage of the fair market value that is determined by local assessors to be the total taxable value of land and additions on the property. | Land | Improvement |
|---|---|---|---|---|
| 2025 | $9,210 | $626,877 | $190,003 | $443,874 |
| 2024 | $9,210 | $614,451 | $186,279 | $435,172 |
| 2023 | $8,909 | $609,267 | $182,626 | $426,641 |
| 2022 | $8,749 | $590,322 | $179,046 | $418,276 |
| 2021 | $8,553 | $578,610 | $175,535 | $410,075 |
| 2020 | $8,387 | $579,607 | $173,736 | $405,871 |
| 2019 | $8,464 | $568,245 | $170,330 | $397,915 |
| 2018 | $8,268 | $557,105 | $166,991 | $390,114 |
| 2017 | $8,070 | $546,183 | $163,717 | $382,466 |
| 2016 | $7,777 | $535,477 | $160,508 | $374,969 |
| 2015 | $7,629 | $527,433 | $158,097 | $369,336 |
| 2014 | $7,343 | $517,104 | $155,001 | $362,103 |
Source: Public Records
Map
Nearby Homes
- 32656 Brenda Way Unit 2
- 32625 Brenda Way Unit 1
- 32224 Sloccum Ct
- 2116 Sunsprite Dr
- 2432 Balmoral St
- 2447 Douglas St
- 32651 Singh Cir
- 2473 Balmoral St
- 179 Kona Cir
- 426 Honolulu Cir
- 418 Fiji Cir Unit 418
- 23 Palm Dr
- 3020 San Andreas Dr
- 259 Molokai Cir Unit 259
- 30 Palm Dr Unit 30
- 33010 Lake Mead Dr
- 269 Oahu Cir
- 32471 Lake Ree St
- 32262 Crest Ln
- 301 Maui Cir
- 2192 Champlain Way
- 2200 Champlain Ct
- 32433 London Ct
- 32436 Derby Ct
- 2188 Champlain Way
- 2204 Champlain Ct
- 32701 Amethyst Way
- 32425 London Ct
- 32428 Derby Ct
- 2205 Champlain Ct
- 2184 Champlain Way
- 2208 Champlain Ct
- 32700 Amethyst Way
- 32709 Amethyst Way
- 32417 London Ct
- 32420 Derby Ct
- 2209 Champlain Ct
- 32708 Amethyst Way
- 2180 Champlain Way
- 32409 London Ct
Your Personal Tour Guide
Ask me questions while you tour the home.