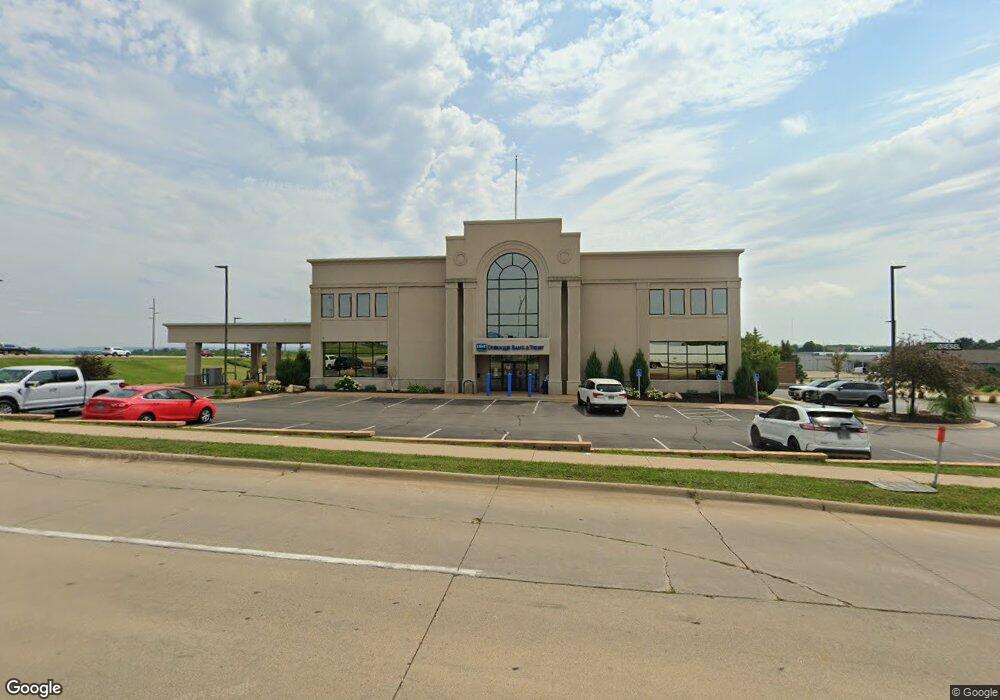
2196 Holliday Dr Unit Second Floor Dubuque, IA 52002
Estimated Value: $2,954,769
--
Bed
--
Bath
7,650
Sq Ft
$386/Sq Ft
Est. Value
About This Home
This home is located at 2196 Holliday Dr Unit Second Floor, Dubuque, IA 52002 and is currently estimated at $2,954,769, approximately $386 per square foot. 2196 Holliday Dr Unit Second Floor is a home located in Dubuque County with nearby schools including Carver Elementary School, Eleanor Roosevelt Middle School, and Hempstead High School.
Ownership History
Date
Name
Owned For
Owner Type
Purchase Details
Closed on
Aug 21, 2018
Sold by
Courtside Properties Llc
Bought by
T & M Properties Llc
Current Estimated Value
Purchase Details
Closed on
Oct 23, 2014
Sold by
Wbbw Holliday Development Llc
Bought by
Warrior Enterprises Llc
Purchase Details
Closed on
Jun 22, 2012
Sold by
Wbbw Holliday Development Llc
Bought by
Sjcg Properties Llc
Purchase Details
Closed on
May 31, 2012
Sold by
Gomer Holliday Development Llc
Bought by
Green Acres Storage Llc
Purchase Details
Closed on
Oct 29, 2007
Sold by
Commercial Holliday Development Llc
Bought by
Gomer Holliday Development Llc
Purchase Details
Closed on
Dec 27, 2006
Sold by
Spiegel A J
Bought by
United Rentals Inc
Create a Home Valuation Report for This Property
The Home Valuation Report is an in-depth analysis detailing your home's value as well as a comparison with similar homes in the area
Home Values in the Area
Average Home Value in this Area
Purchase History
| Date | Buyer | Sale Price | Title Company |
|---|---|---|---|
| T & M Properties Llc | $2,075,000 | None Available | |
| Warrior Enterprises Llc | $573,500 | None Available | |
| Sjcg Properties Llc | $436,000 | None Available | |
| Green Acres Storage Llc | $908,000 | None Available | |
| Gomer Holliday Development Llc | $2,057,000 | None Available | |
| United Rentals Inc | $43,000 | None Available |
Source: Public Records
Tax History Compared to Growth
Tax History
| Year | Tax Paid | Tax Assessment Tax Assessment Total Assessment is a certain percentage of the fair market value that is determined by local assessors to be the total taxable value of land and additions on the property. | Land | Improvement |
|---|---|---|---|---|
| 2025 | $108,710 | $4,633,100 | $1,037,100 | $3,596,000 |
| 2024 | $108,710 | $4,055,100 | $732,600 | $3,322,500 |
| 2023 | $107,966 | $4,055,100 | $732,600 | $3,322,500 |
| 2022 | $87,176 | $3,252,870 | $586,080 | $2,666,790 |
| 2021 | $87,176 | $3,252,870 | $586,080 | $2,666,790 |
| 2020 | $92,060 | $3,252,870 | $586,080 | $2,666,790 |
| 2019 | $91,126 | $3,252,870 | $586,080 | $2,666,790 |
| 2018 | $91,832 | $3,192,190 | $547,008 | $2,645,182 |
| 2017 | $94,458 | $3,192,190 | $547,008 | $2,645,182 |
| 2016 | $94,458 | $3,192,190 | $547,008 | $2,645,182 |
| 2015 | $94,718 | $3,192,190 | $547,008 | $2,645,182 |
| 2014 | $82,618 | $2,850,170 | $488,400 | $2,361,770 |
Source: Public Records
Map
Nearby Homes
- 4957 Twilight Dr
- 5133 Asbury Rd
- Lot 6 Mill Ridge Rd
- 3725 Asbury Rd
- 2023 Clifford St
- 3575 Lisa Ct
- Lot 3 Shagbark Plat 3 Ln Unit 4461 Barnwood Lane
- Lot 191 Forest Hills Estates Dr Unit 6024 Stockwood Dr
- 0 Chavenelle Unit 4050 Westmark Drive
- 0 Chavenelle Unit at Seippel Road
- 3660 Hillcrest Rd
- Lot Hillcrest Rd
- 2145 Saint John Dr
- 3631 Keymeer Dr
- 3519 Hillcrest Rd
- 3462 Asbury Rd
- 2090 Key Largo Dr
- 2628 Dove St
- 1555 Donovan Dr
- 1754 Vizaleea Dr
- 4825 Asbury Rd
- 4835 Asbury Rd
- 4840 Asbury Rd
- 4840 Asbury Rd Unit 5
- 4840 Asbury Rd Unit Suite 106
- 4840 Asbury Rd Unit Suite 103
- 4840 Asbury Rd Unit Suite 102
- 4855 Asbury Unit 8 Rd
- 4855 Asbury Rd
- 4855 Asbury Rd Unit 4
- 4855 Asbury Rd Unit Suite 4
- 4855 Asbury Rd Unit Suite 1
- 4855 Asbury Rd Unit Suite 8
- 4867 Asbury Rd Unit 4
- 4867 Asbury Rd
- 2345 NW Arterial
- 4860 Asbury Rd
- 4885 Asbury Rd
- 195 Asbury Rd
- 2075 Holliday Dr