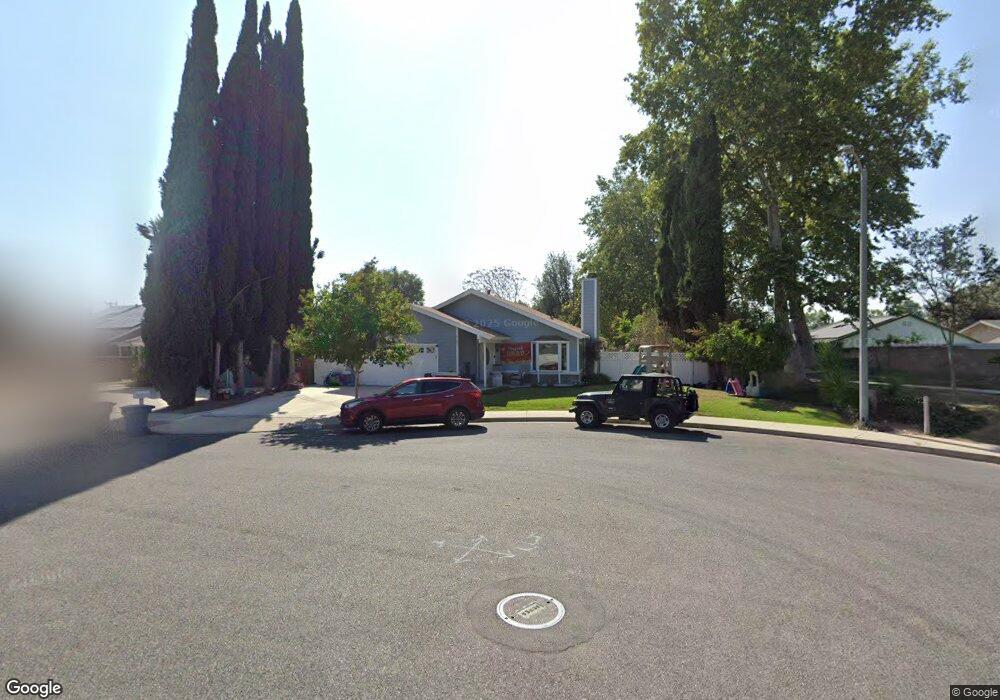
2197 Hurles Ave Simi Valley, CA 93063
Central Simi Valley NeighborhoodEstimated Value: $633,000 - $761,000
2
Beds
1
Bath
1,108
Sq Ft
$646/Sq Ft
Est. Value
About This Home
This home is located at 2197 Hurles Ave, Simi Valley, CA 93063 and is currently estimated at $715,864, approximately $646 per square foot. 2197 Hurles Ave is a home located in Ventura County with nearby schools including Garden Grove Elementary School, Hillside Middle School, and Simi Valley High School.
Ownership History
Date
Name
Owned For
Owner Type
Purchase Details
Closed on
Dec 13, 2021
Sold by
Pringle Living Trust
Bought by
Russell Shaun and Russell Patricia
Current Estimated Value
Home Financials for this Owner
Home Financials are based on the most recent Mortgage that was taken out on this home.
Original Mortgage
$581,875
Interest Rate
3.69%
Mortgage Type
New Conventional
Purchase Details
Closed on
Sep 24, 2012
Sold by
Pringle Robert R and Pringle Linda M
Bought by
Pringle Robert and Pringle Linda
Purchase Details
Closed on
Feb 26, 2010
Sold by
Duncan Irene L
Bought by
Pringle Robert R and Pringle Linda M
Home Financials for this Owner
Home Financials are based on the most recent Mortgage that was taken out on this home.
Original Mortgage
$150,000
Interest Rate
4.29%
Mortgage Type
New Conventional
Purchase Details
Closed on
Feb 18, 2000
Sold by
Kuylen Henry E and Kuylen Gisela H
Bought by
Kuylen Henry E and Kuylen Gisela H
Create a Home Valuation Report for This Property
The Home Valuation Report is an in-depth analysis detailing your home's value as well as a comparison with similar homes in the area
Home Values in the Area
Average Home Value in this Area
Purchase History
| Date | Buyer | Sale Price | Title Company |
|---|---|---|---|
| Russell Shaun | $612,500 | Lawyers Title | |
| Pringle Robert | -- | None Available | |
| Pringle Robert R | $250,000 | Consumers Title Company | |
| Kuylen Henry E | -- | -- |
Source: Public Records
Mortgage History
| Date | Status | Borrower | Loan Amount |
|---|---|---|---|
| Previous Owner | Russell Shaun | $581,875 | |
| Previous Owner | Pringle Robert R | $150,000 |
Source: Public Records
Tax History Compared to Growth
Tax History
| Year | Tax Paid | Tax Assessment Tax Assessment Total Assessment is a certain percentage of the fair market value that is determined by local assessors to be the total taxable value of land and additions on the property. | Land | Improvement |
|---|---|---|---|---|
| 2025 | $8,495 | $711,009 | $462,157 | $248,852 |
| 2024 | $8,495 | $697,068 | $453,095 | $243,973 |
| 2023 | $7,993 | $683,400 | $444,210 | $239,190 |
| 2022 | $4,595 | $358,811 | $179,406 | $179,405 |
| 2021 | $4,553 | $351,776 | $175,888 | $175,888 |
| 2020 | $4,454 | $348,172 | $174,086 | $174,086 |
| 2019 | $4,252 | $341,346 | $170,673 | $170,673 |
| 2018 | $4,211 | $334,654 | $167,327 | $167,327 |
| 2017 | $4,114 | $328,094 | $164,047 | $164,047 |
| 2016 | $3,929 | $321,662 | $160,831 | $160,831 |
| 2015 | $3,843 | $316,832 | $158,416 | $158,416 |
| 2014 | $3,784 | $310,628 | $155,314 | $155,314 |
Source: Public Records
Map
Nearby Homes
- 2241 Century Place
- 2085 Bolivar Ct
- 3845 Bayside St
- 3887 Aztec Ct
- 3872 Aztec Ct
- 3867 Delano Ct
- 3998 Celia Ct
- 2250 N Goddard Ave
- 3954 Cochran St Unit 61
- 2439 Lita Place
- 2433 Medina Ave
- 3474 Highwood Ct Unit 80
- 2358 Medina Ave
- 3434 Highwood Ct Unit 183
- 2282 Brentwood St
- 4109 Helene St
- 3342 Darby St Unit 317
- 3306 Darby St Unit 402
- 1638 Olympic St
- 4141 Eileen St
- 2191 Hurles Ave
- 2196 Samson Ave
- 2179 Hurles Ave
- 2205 Century Place
- 2204 Corlson Place
- 2190 Samson Ave
- 2192 Hurles Ave
- 2180 Hurles Ave
- 2198 Hurles Ave
- 2147 Hurles Ave
- 2213 Century Place
- 2212 Corlson Place
- 2148 Hurles Ave
- 2178 Samson Ave
- 2134 Hurles Ave
- 2219 Century Place
- 2218 Corlson Place
- 2135 Hurles Ave
- 2151 Tracy Ave
- 2166 Samson Ave