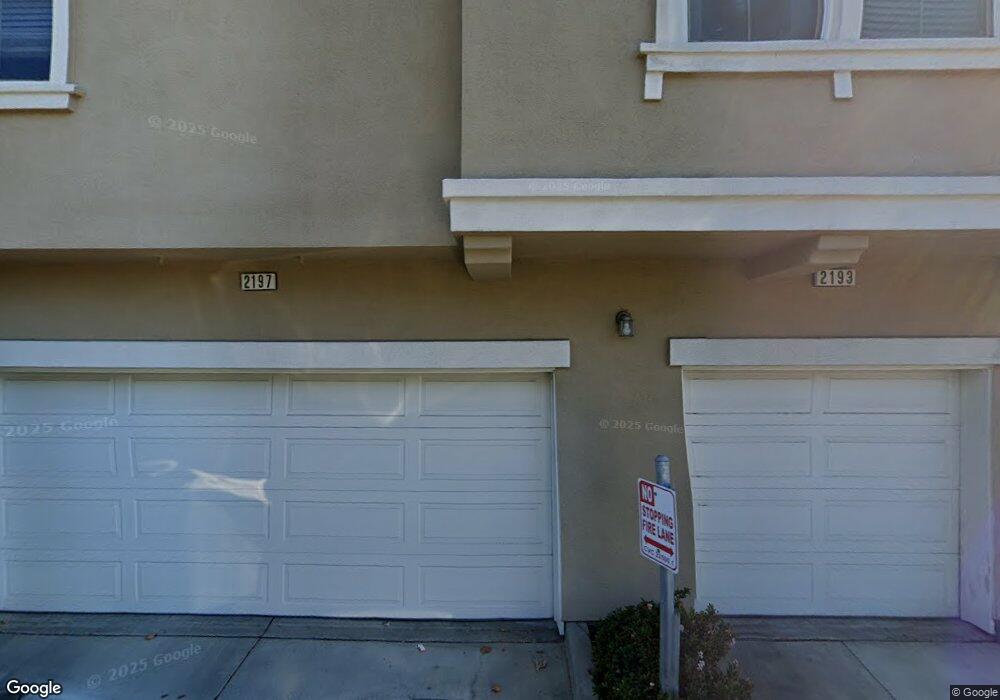
2197 Pomme Ct San Jose, CA 95125
South San Jose NeighborhoodEstimated Value: $833,370 - $1,002,000
2
Beds
2
Baths
1,340
Sq Ft
$695/Sq Ft
Est. Value
About This Home
This home is located at 2197 Pomme Ct, San Jose, CA 95125 and is currently estimated at $931,093, approximately $694 per square foot. 2197 Pomme Ct is a home located in Santa Clara County with nearby schools including George Shirakawa Sr. Elementary School, Sylvandale Middle School, and Yerba Buena High School.
Ownership History
Date
Name
Owned For
Owner Type
Purchase Details
Closed on
Nov 19, 2009
Sold by
Sagabaen Jose and Sagabaen Lynn
Bought by
Hara Larry S
Current Estimated Value
Home Financials for this Owner
Home Financials are based on the most recent Mortgage that was taken out on this home.
Original Mortgage
$288,000
Outstanding Balance
$186,895
Interest Rate
4.88%
Mortgage Type
New Conventional
Estimated Equity
$744,198
Purchase Details
Closed on
Nov 16, 2009
Sold by
Hara Maureen M
Bought by
Hara Larry
Home Financials for this Owner
Home Financials are based on the most recent Mortgage that was taken out on this home.
Original Mortgage
$288,000
Outstanding Balance
$186,895
Interest Rate
4.88%
Mortgage Type
New Conventional
Estimated Equity
$744,198
Purchase Details
Closed on
Aug 24, 2006
Sold by
Taylor Woodrow Homes Inc
Bought by
Sagabaen Jose and Sagabaen Lynn
Home Financials for this Owner
Home Financials are based on the most recent Mortgage that was taken out on this home.
Original Mortgage
$85,454
Interest Rate
6.3%
Mortgage Type
Credit Line Revolving
Create a Home Valuation Report for This Property
The Home Valuation Report is an in-depth analysis detailing your home's value as well as a comparison with similar homes in the area
Home Values in the Area
Average Home Value in this Area
Purchase History
| Date | Buyer | Sale Price | Title Company |
|---|---|---|---|
| Hara Larry S | $360,000 | Fidelity National Title Co | |
| Hara Larry | -- | Fidelity National Title Co | |
| Sagabaen Jose | $570,000 | First Amer Title Guaranty Co |
Source: Public Records
Mortgage History
| Date | Status | Borrower | Loan Amount |
|---|---|---|---|
| Open | Hara Larry S | $288,000 | |
| Previous Owner | Sagabaen Jose | $85,454 |
Source: Public Records
Tax History Compared to Growth
Tax History
| Year | Tax Paid | Tax Assessment Tax Assessment Total Assessment is a certain percentage of the fair market value that is determined by local assessors to be the total taxable value of land and additions on the property. | Land | Improvement |
|---|---|---|---|---|
| 2025 | $7,891 | $464,676 | $232,338 | $232,338 |
| 2024 | $7,891 | $455,566 | $227,783 | $227,783 |
| 2023 | $7,716 | $446,634 | $223,317 | $223,317 |
| 2022 | $7,463 | $437,878 | $218,939 | $218,939 |
| 2021 | $7,377 | $429,294 | $214,647 | $214,647 |
| 2020 | $6,986 | $424,894 | $212,447 | $212,447 |
| 2019 | $6,671 | $416,564 | $208,282 | $208,282 |
| 2018 | $6,651 | $408,398 | $204,199 | $204,199 |
| 2017 | $6,559 | $400,392 | $200,196 | $200,196 |
| 2016 | $6,281 | $392,542 | $196,271 | $196,271 |
| 2015 | $6,218 | $386,646 | $193,323 | $193,323 |
| 2014 | $5,703 | $379,074 | $189,537 | $189,537 |
Source: Public Records
Map
Nearby Homes
- 342 Olive Hill Dr Unit 35
- 553 Mill Pond Dr Unit 553
- 556 Mill Pond Dr Unit 556
- 464 Mill Pond Dr Unit 464
- 2178 Monticello Ave
- 534 Mill Pond Dr
- 532A Mill Pond Dr Unit 532 A
- 375 Mill Pond Dr Unit 375
- 1850 Evans Ln Unit 81
- 2427 Azevedo Pkwy
- 317 Perrymont Ave
- 707 Mill Stream Dr Unit 707
- 707 Mill Stream Dr
- 2128 Canoas Garden Ave Unit D
- 2150 Almaden Rd Unit 147
- 2150 Almaden Rd
- 2150 Almaden Rd Unit 103
- 2661 Carol Dr
- 2296 Almaden Rd Unit B
- 2070 Almaden Rd
- 2133 Sunstruck Ct
- 2139 Sunstruck Ct
- 2298 Winepol Loop
- 2294 Winepol Loop
- 2136 Lindsey Ct
- 2130 Lindsey Ct
- 2193 Pomme Ct
- 2180 Sunstruck Ct Unit 123
- 322 Olive Hill Dr Unit 29
- 2270 Winepol Loop Unit 21
- 2276 Winepol Loop
- 2234 Winepol Loop
- 2117 Lindsey Ct
- 2123 Lindsey Ct
- 2111 Lindsey Ct Unit 91
- 2105 Lindsey Ct Unit 90
- 2124 Lindsey Ct
- 2118 Lindsey Ct Unit 97
- 2106 Lindsey Ct Unit 99
- 2112 Lindsey Ct Unit 98