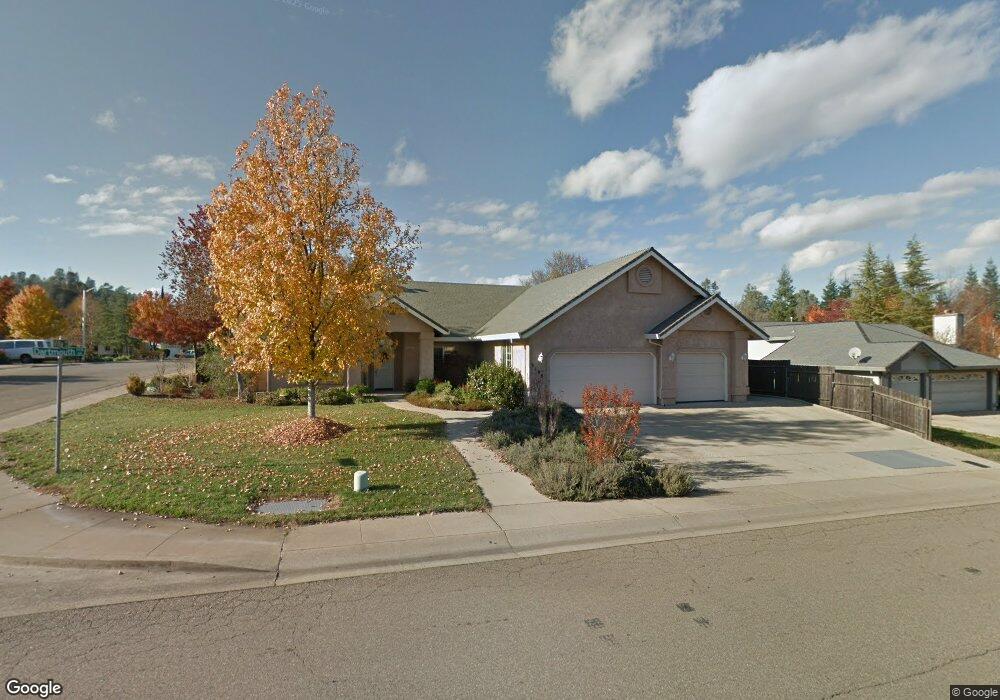
2198 Dartmouth Dr Redding, CA 96001
Ridgeview NeighborhoodEstimated Value: $461,809 - $507,000
3
Beds
2
Baths
2,053
Sq Ft
$236/Sq Ft
Est. Value
About This Home
This home is located at 2198 Dartmouth Dr, Redding, CA 96001 and is currently estimated at $485,452, approximately $236 per square foot. 2198 Dartmouth Dr is a home located in Shasta County with nearby schools including Manzanita Elementary School, Sequoia Middle School, and Shasta High School.
Ownership History
Date
Name
Owned For
Owner Type
Purchase Details
Closed on
Jul 2, 1997
Sold by
Woodfill David L and Woodfill Marietta
Bought by
Huddon Thomas R and Huddon Pamela A
Current Estimated Value
Home Financials for this Owner
Home Financials are based on the most recent Mortgage that was taken out on this home.
Original Mortgage
$100,000
Interest Rate
7.83%
Purchase Details
Closed on
May 5, 1997
Sold by
Woodfill David L and Woodfill Marietta
Bought by
Nadeker Joseph J and Nadeker Klara S
Home Financials for this Owner
Home Financials are based on the most recent Mortgage that was taken out on this home.
Original Mortgage
$100,000
Interest Rate
7.83%
Purchase Details
Closed on
Dec 16, 1996
Sold by
Medley Robt G and Medley Marilyn
Bought by
Woodfill David L and Woodfill Marietta
Home Financials for this Owner
Home Financials are based on the most recent Mortgage that was taken out on this home.
Original Mortgage
$142,200
Interest Rate
7.86%
Mortgage Type
Construction
Create a Home Valuation Report for This Property
The Home Valuation Report is an in-depth analysis detailing your home's value as well as a comparison with similar homes in the area
Home Values in the Area
Average Home Value in this Area
Purchase History
| Date | Buyer | Sale Price | Title Company |
|---|---|---|---|
| Huddon Thomas R | $161,500 | Chicago Title Co | |
| Nadeker Joseph J | $15,500 | Chicago Title Co | |
| Woodfill David L | $31,000 | Chicago Title Co |
Source: Public Records
Mortgage History
| Date | Status | Borrower | Loan Amount |
|---|---|---|---|
| Closed | Huddon Thomas R | $100,000 | |
| Previous Owner | Woodfill David L | $142,200 |
Source: Public Records
Tax History Compared to Growth
Tax History
| Year | Tax Paid | Tax Assessment Tax Assessment Total Assessment is a certain percentage of the fair market value that is determined by local assessors to be the total taxable value of land and additions on the property. | Land | Improvement |
|---|---|---|---|---|
| 2025 | $2,696 | $257,840 | $49,483 | $208,357 |
| 2024 | $2,652 | $252,785 | $48,513 | $204,272 |
| 2023 | $2,652 | $247,829 | $47,562 | $200,267 |
| 2022 | $2,607 | $242,971 | $46,630 | $196,341 |
| 2021 | $2,586 | $238,208 | $45,716 | $192,492 |
| 2020 | $2,717 | $235,767 | $45,248 | $190,519 |
| 2019 | $2,586 | $231,145 | $44,361 | $186,784 |
| 2018 | $2,605 | $226,614 | $43,492 | $183,122 |
| 2017 | $2,589 | $222,172 | $42,640 | $179,532 |
| 2016 | $2,517 | $217,816 | $41,804 | $176,012 |
| 2015 | $2,452 | $214,546 | $41,177 | $173,369 |
| 2014 | $2,467 | $210,344 | $40,371 | $169,973 |
Source: Public Records
Map
Nearby Homes
- 1783 Record Ln
- 4125 Oro St
- 2166 Wicklow St
- 4613 Nantucket Dr
- 3811 Andes Dr
- 4160 Travona Ct
- 1756 Mary Lake Dr
- 0 Thompson Ln
- 1640 Wisconsin Ave
- 1605 Wisconsin Ave
- 3261 Misty Glen Dr
- 1474 Gladstone Ct
- 4692 Corita Place
- 2920 Aspen Glow Ln
- 2925 Aspen Glow Ln
- 3380 Placer St
- 16520 Blarney Ln
- 000 Weseman Rd
- 4648 Kilkee Dr
- 4105 Winter Green Ct
- 2176 Dartmouth Dr
- 4104 Villa Dr
- 2224 Dartmouth Dr
- 2195 Dartmouth Dr
- 4118 Villa Dr
- 2187 Dartmouth Dr
- 2215 Dartmouth Dr
- 2154 Dartmouth Dr
- 2165 Dartmouth Dr
- 4107 Villa Dr
- 2233 Dartmouth Dr
- 0 Dartmouth Dr
- 2246 Dartmouth Dr
- 4132 Villa Dr
- 4121 Villa Dr
- 2220 Siena Ave
- 2210 Siena Ave
- 2230 Siena Ave
- 4140 Villa Dr
- 2142 Dartmouth Dr