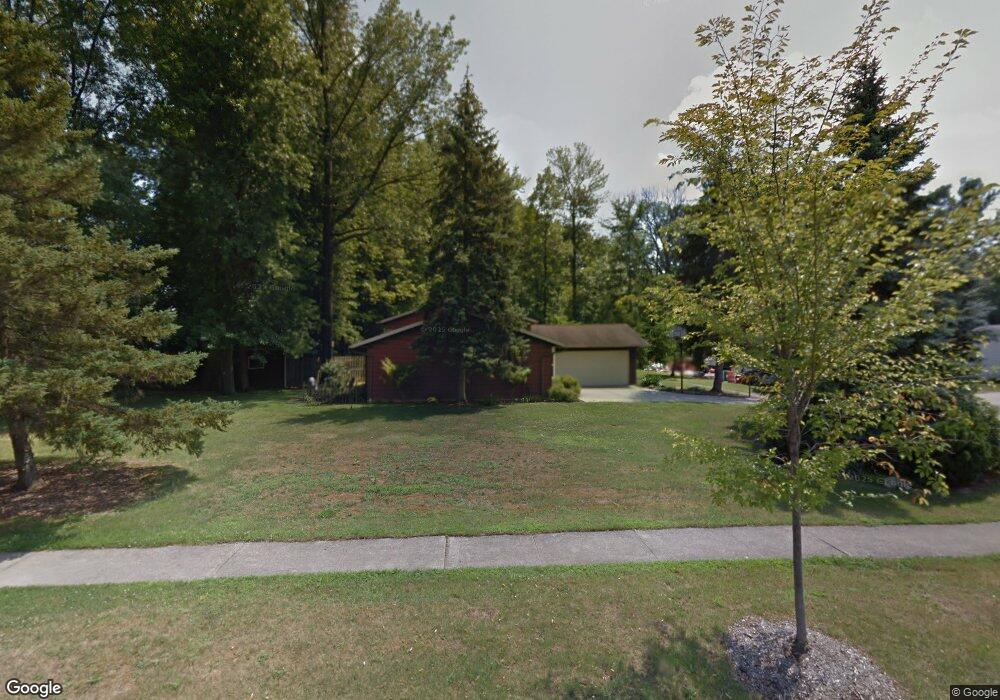
21983 Jonathan Dr Strongsville, OH 44149
Estimated Value: $209,000 - $295,488
3
Beds
2
Baths
1,844
Sq Ft
$137/Sq Ft
Est. Value
About This Home
This home is located at 21983 Jonathan Dr, Strongsville, OH 44149 and is currently estimated at $252,372, approximately $136 per square foot. 21983 Jonathan Dr is a home located in Cuyahoga County with nearby schools including Strongsville High School, St Mary School, and Sts Joseph & John Interparochial School.
Ownership History
Date
Name
Owned For
Owner Type
Purchase Details
Closed on
Apr 25, 2025
Sold by
Nicak Richard R
Bought by
Saari Daniel
Current Estimated Value
Home Financials for this Owner
Home Financials are based on the most recent Mortgage that was taken out on this home.
Original Mortgage
$156,937
Outstanding Balance
$156,099
Interest Rate
6.65%
Mortgage Type
VA
Estimated Equity
$96,273
Purchase Details
Closed on
Jan 22, 1988
Sold by
Karkosiak Daniel M
Bought by
Nicak Richard R
Purchase Details
Closed on
Mar 28, 1984
Sold by
Mcclain Douglas J
Bought by
Karkosiak Daniel M
Purchase Details
Closed on
Aug 23, 1977
Sold by
Horsky Norman J
Bought by
Mcclain Douglas J
Purchase Details
Closed on
Feb 26, 1976
Sold by
Sempolski Frank and Sempolski Lynn
Bought by
Horsky Norman J
Purchase Details
Closed on
Jan 1, 1975
Bought by
Sempolski Frank and Sempolski Lynn
Create a Home Valuation Report for This Property
The Home Valuation Report is an in-depth analysis detailing your home's value as well as a comparison with similar homes in the area
Home Values in the Area
Average Home Value in this Area
Purchase History
| Date | Buyer | Sale Price | Title Company |
|---|---|---|---|
| Saari Daniel | $205,000 | Chicago Title | |
| Nicak Richard R | $97,000 | -- | |
| Karkosiak Daniel M | $81,900 | -- | |
| Mcclain Douglas J | $67,000 | -- | |
| Horsky Norman J | $57,500 | -- | |
| Sempolski Frank | -- | -- |
Source: Public Records
Mortgage History
| Date | Status | Borrower | Loan Amount |
|---|---|---|---|
| Open | Saari Daniel | $156,937 |
Source: Public Records
Tax History Compared to Growth
Tax History
| Year | Tax Paid | Tax Assessment Tax Assessment Total Assessment is a certain percentage of the fair market value that is determined by local assessors to be the total taxable value of land and additions on the property. | Land | Improvement |
|---|---|---|---|---|
| 2024 | $3,934 | $83,790 | $18,830 | $64,960 |
| 2023 | $4,273 | $68,250 | $17,710 | $50,540 |
| 2022 | $4,242 | $68,250 | $17,710 | $50,540 |
| 2021 | $4,209 | $68,250 | $17,710 | $50,540 |
| 2020 | $3,902 | $55,970 | $14,530 | $41,440 |
| 2019 | $3,787 | $159,900 | $41,500 | $118,400 |
| 2018 | $3,409 | $55,970 | $14,530 | $41,440 |
| 2017 | $3,444 | $51,910 | $13,930 | $37,980 |
| 2016 | $3,416 | $51,910 | $13,930 | $37,980 |
| 2015 | $5,107 | $51,910 | $13,930 | $37,980 |
| 2014 | $5,107 | $50,400 | $13,510 | $36,890 |
Source: Public Records
Map
Nearby Homes
- 8627 Courtland Dr
- 8902 Lincolnshire Blvd
- 9829 Plum Brook Ln
- 9598 Pebble Brook Ln
- 8036 Fair Rd
- 22300 Rock Creek Cir
- 8746 Barton Dr
- 0 Priem Rd
- 10353 Oak Branch Trail
- 84 Sprague Rd
- 21355 Hickory Branch Trail
- 740 Fair St
- 21176 Hickory Branch Trail
- 104 Whitehall Dr
- 243 Jananna Dr
- 9384 N Marks Rd
- 9401 Pheasant Run Place
- 10001 N Marks Rd
- 458 Sprague Rd
- 10839 Prospect Rd
- 21887 Jonathan Dr
- 21989 Jonathan Dr
- 8671 Courtland Dr
- 21835 Jonathan Dr
- 21993 Jonathan Dr
- 21592 Willow Ln
- 8669 Courtland Dr
- 21992 Jonathan Dr
- 21560 Willow Ln
- 21783 Jonathan Dr
- 21997 Jonathan Dr
- 21860 Montclare Blvd
- 21996 Jonathan Dr
- 21526 Willow Ln
- 8665 Courtland Dr
- 21731 Jonathan Dr
- 22001 Jonathan Dr
- 21595 Willow Ln
- 22002 Jonathan Dr
- 8664 Courtland Dr