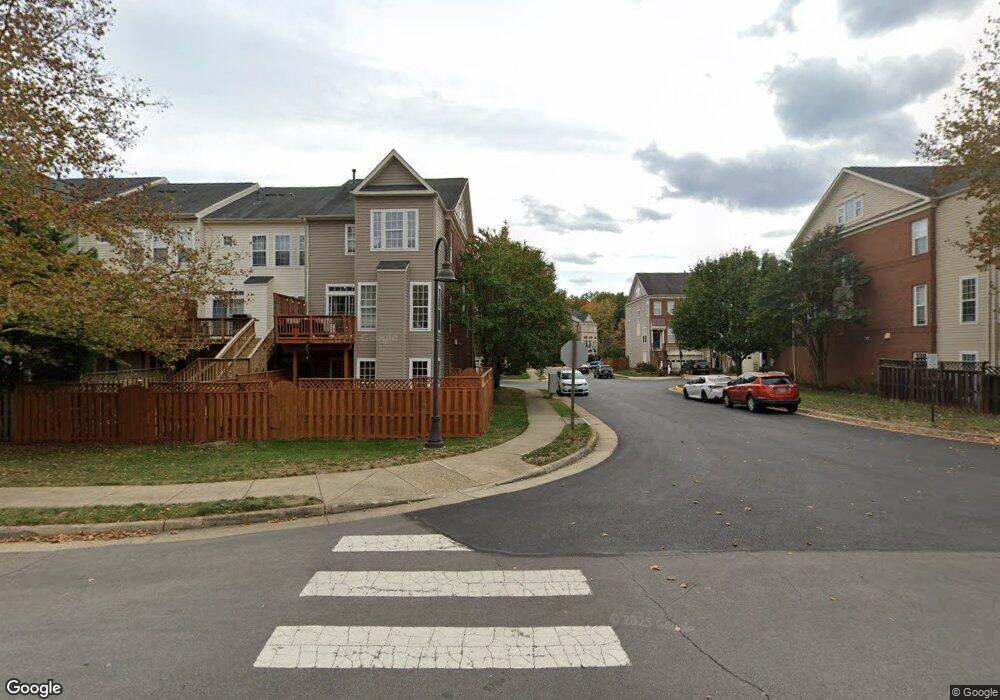
21989 Windy Oaks Square Broadlands, VA 20148
Estimated Value: $871,365 - $921,000
3
Beds
4
Baths
3,539
Sq Ft
$255/Sq Ft
Est. Value
About This Home
This home is located at 21989 Windy Oaks Square, Broadlands, VA 20148 and is currently estimated at $902,091, approximately $254 per square foot. 21989 Windy Oaks Square is a home located in Loudoun County with nearby schools including Mill Run Elementary School, Eagle Ridge Middle School, and Briar Woods High School.
Ownership History
Date
Name
Owned For
Owner Type
Purchase Details
Closed on
Feb 10, 2025
Sold by
Ballentine Greta K and Henry Gary Lee
Bought by
Chan Ke-Winn and Tan Huey Jiun
Current Estimated Value
Home Financials for this Owner
Home Financials are based on the most recent Mortgage that was taken out on this home.
Original Mortgage
$726,400
Outstanding Balance
$722,033
Interest Rate
6.85%
Mortgage Type
New Conventional
Estimated Equity
$180,058
Purchase Details
Closed on
May 8, 2019
Sold by
Ballentine Greta K and Ballard Greta K
Bought by
Lee Ballentine Greta K and Lee Henry Gary
Purchase Details
Closed on
Dec 12, 2005
Sold by
Van Metre Homes At Broadl
Bought by
Ballard Greta
Home Financials for this Owner
Home Financials are based on the most recent Mortgage that was taken out on this home.
Original Mortgage
$548,700
Interest Rate
6.39%
Mortgage Type
New Conventional
Create a Home Valuation Report for This Property
The Home Valuation Report is an in-depth analysis detailing your home's value as well as a comparison with similar homes in the area
Home Values in the Area
Average Home Value in this Area
Purchase History
| Date | Buyer | Sale Price | Title Company |
|---|---|---|---|
| Chan Ke-Winn | $908,000 | First American Title | |
| Lee Ballentine Greta K | -- | None Available | |
| Ballard Greta | $685,924 | -- |
Source: Public Records
Mortgage History
| Date | Status | Borrower | Loan Amount |
|---|---|---|---|
| Open | Chan Ke-Winn | $726,400 | |
| Previous Owner | Ballard Greta | $548,700 |
Source: Public Records
Tax History Compared to Growth
Tax History
| Year | Tax Paid | Tax Assessment Tax Assessment Total Assessment is a certain percentage of the fair market value that is determined by local assessors to be the total taxable value of land and additions on the property. | Land | Improvement |
|---|---|---|---|---|
| 2025 | $6,318 | $784,850 | $240,000 | $544,850 |
| 2024 | $6,541 | $756,150 | $240,000 | $516,150 |
| 2023 | $6,278 | $717,450 | $200,000 | $517,450 |
| 2022 | $6,147 | $690,700 | $180,000 | $510,700 |
| 2021 | $5,898 | $601,850 | $160,000 | $441,850 |
| 2020 | $5,837 | $563,930 | $150,000 | $413,930 |
| 2019 | $5,579 | $533,880 | $150,000 | $383,880 |
| 2018 | $5,677 | $523,240 | $135,000 | $388,240 |
| 2017 | $5,592 | $497,060 | $135,000 | $362,060 |
| 2016 | $5,499 | $480,260 | $0 | $0 |
| 2015 | $5,489 | $348,640 | $0 | $348,640 |
| 2014 | $5,423 | $344,490 | $0 | $344,490 |
Source: Public Records
Map
Nearby Homes
- 40396 Milford Dr
- Cameron 24-R1-RT Plan at Demott and Silver at Broadlands - Demott and Silver
- Collier 24-R1 Plan at Demott and Silver at Broadlands - Demott and Silver
- Collier 24-R1-RT Plan at Demott and Silver at Broadlands - Demott and Silver
- Cameron 24-R1 Plan at Demott and Silver at Broadlands - Demott and Silver
- 43294 Farringdon Square
- 43298 Farringdon Square
- 43302 Farringdon Square
- 43234 Farringdon Square
- 21816 Ainsley Ct
- 21843 Beckhorn Station Terrace
- 21823 Beckhorn Station Terrace
- 21752 Dollis Hill Terrace
- 21748 Dollis Hill Terrace
- 43497 Farringdon Square
- 43376 Farringdon Square
- 43382 Farringdon Square
- 22141 Midmoore Dr
- 22143 Little Mount Terrace
- 22153 Midmoore Dr
- 21987 Windy Oaks Square
- 21991 Windy Oaks Square
- 21985 Windy Oaks Square
- 21993 Windy Oaks Square
- 21983 Windy Oaks Square
- 43143 Crosswind Terrace
- 43145 Crosswind Terrace
- 43149 Crosswind Terrace
- 43139 Crosswind Terrace
- 43151 Crosswind Terrace
- 21962 Windy Oaks Square
- 43137 Crosswind Terrace
- 43153 Crosswind Terrace
- 43135 Crosswind Terrace
- 21960 Windy Oaks Square
- 43155 Crosswind Terrace
- 43133 Crosswind Terrace
- 21958 Windy Oaks Square
- 43131 Crosswind Terrace
- 21956 Windy Oaks Square