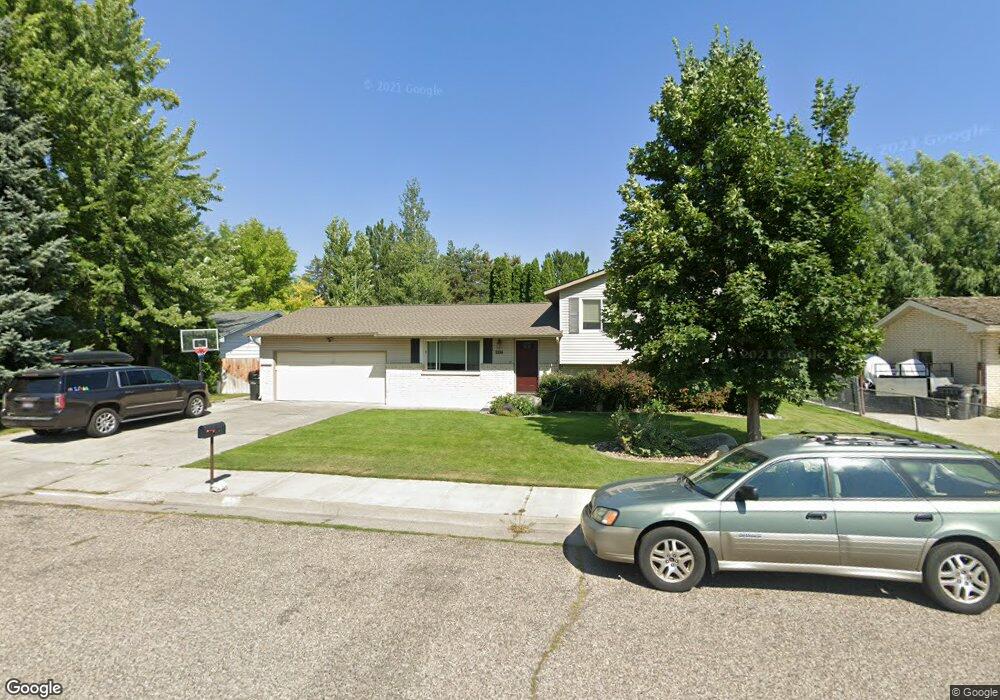
2199 Briarcliff Ave Idaho Falls, ID 83404
Estimated Value: $372,000 - $391,000
4
Beds
3
Baths
2,407
Sq Ft
$157/Sq Ft
Est. Value
About This Home
This home is located at 2199 Briarcliff Ave, Idaho Falls, ID 83404 and is currently estimated at $378,817, approximately $157 per square foot. 2199 Briarcliff Ave is a home located in Bonneville County with nearby schools including Theresa Bunker Elementary School, Taylorview Middle School, and Idaho Falls Senior High School.
Ownership History
Date
Name
Owned For
Owner Type
Purchase Details
Closed on
Oct 4, 2022
Sold by
Bench Thomas and Bench Maren
Bought by
Thomas And Maren Bench Trust
Current Estimated Value
Purchase Details
Closed on
Apr 9, 2015
Sold by
Lott James C
Bought by
Bench Thomas and Bench Maren
Purchase Details
Closed on
Aug 21, 2008
Sold by
Lott Deannia L and Lott James C
Bought by
Lott James C
Home Financials for this Owner
Home Financials are based on the most recent Mortgage that was taken out on this home.
Original Mortgage
$155,123
Interest Rate
6.27%
Mortgage Type
FHA
Purchase Details
Closed on
Jan 23, 2006
Sold by
Petersen Chris Eric and Petersen Amy
Bought by
Lott James C and Lott Deannia L
Home Financials for this Owner
Home Financials are based on the most recent Mortgage that was taken out on this home.
Original Mortgage
$153,316
Interest Rate
6.21%
Mortgage Type
FHA
Create a Home Valuation Report for This Property
The Home Valuation Report is an in-depth analysis detailing your home's value as well as a comparison with similar homes in the area
Home Values in the Area
Average Home Value in this Area
Purchase History
| Date | Buyer | Sale Price | Title Company |
|---|---|---|---|
| Thomas And Maren Bench Trust | -- | -- | |
| Bench Thomas | -- | Alliance Title | |
| Lott James C | -- | None Available | |
| Lott James C | -- | None Available |
Source: Public Records
Mortgage History
| Date | Status | Borrower | Loan Amount |
|---|---|---|---|
| Previous Owner | Lott James C | $155,123 | |
| Previous Owner | Lott James C | $153,316 |
Source: Public Records
Tax History Compared to Growth
Tax History
| Year | Tax Paid | Tax Assessment Tax Assessment Total Assessment is a certain percentage of the fair market value that is determined by local assessors to be the total taxable value of land and additions on the property. | Land | Improvement |
|---|---|---|---|---|
| 2025 | $1,973 | $466,376 | $77,193 | $389,183 |
| 2024 | $1,973 | $407,738 | $53,204 | $354,534 |
| 2023 | $2,017 | $389,754 | $53,204 | $336,550 |
| 2022 | $2,481 | $318,986 | $40,156 | $278,830 |
| 2021 | $1,386 | $204,602 | $36,492 | $168,110 |
| 2019 | $1,525 | $177,367 | $30,417 | $146,950 |
| 2018 | $1,389 | $168,858 | $27,628 | $141,230 |
| 2017 | $1,309 | $145,872 | $20,112 | $125,760 |
| 2016 | $1,170 | $138,743 | $18,293 | $120,450 |
| 2015 | $1,148 | $120,823 | $18,293 | $102,530 |
| 2014 | $34,594 | $120,823 | $18,293 | $102,530 |
| 2013 | -- | $125,403 | $18,293 | $107,110 |
Source: Public Records
Map
Nearby Homes
- 2180 Richards Ave
- 2341 Briarcliff Ave
- 1729 Parley St
- 2275 Oak Trail Dr
- 2356 Oak Trail Dr
- 2444 Saint Clair Rd
- 2202 Balboa Dr
- 1916 Mckinzie Ave
- 1730 E 25th St
- 2050 Belmont Ave
- 2075 Belmont Ave
- 2648 Legends Cir
- 2325 Balboa Dr
- 1890 Niagara St
- 1307 Laurel Dr
- 1896 Jeppson Ave
- 1209 Mojave St
- 1955 E 25th St
- 1750 Coronado St
- 1955 Niagara St
- 2227 Briarcliff Ave
- 2175 Briarcliff Ave
- 2198 S Woodruff Ave
- 2226 S Woodruff Ave
- 2200 Briarcliff Ave
- 1648 Parley St
- 2247 Briarcliff Ave
- 2180 Briarcliff Ave
- 2230 Briarcliff Ave
- 2250 S Woodruff Ave
- 1635 Parley St
- 1635 Parley St
- 2260 Briarcliff Ave
- 1649 Parley St
- 2275 Briarcliff Ave
- 1615 Parley St
- 2225 Richards Ave
- 2278 S Woodruff Ave
- 1595 Parley St
- 2290 Briarcliff Ave