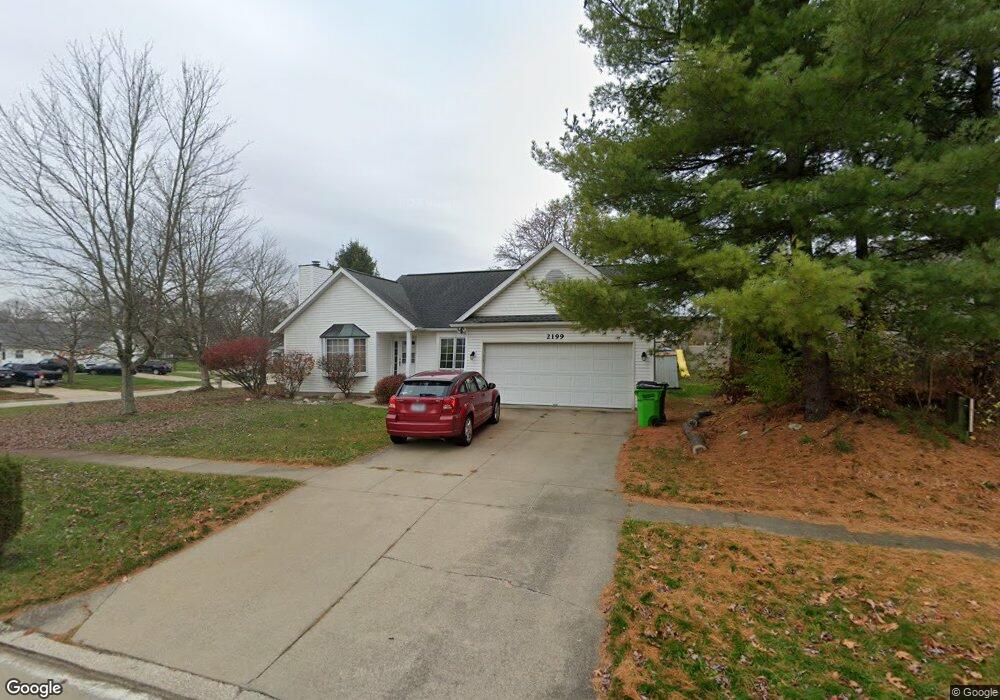
2199 Normandy Dr Wooster, OH 44691
Estimated Value: $266,331 - $313,000
3
Beds
3
Baths
1,346
Sq Ft
$217/Sq Ft
Est. Value
About This Home
This home is located at 2199 Normandy Dr, Wooster, OH 44691 and is currently estimated at $292,583, approximately $217 per square foot. 2199 Normandy Dr is a home located in Wayne County with nearby schools including Parkview Elementary School, Edgewood Middle School, and Wooster High School.
Ownership History
Date
Name
Owned For
Owner Type
Purchase Details
Closed on
Aug 26, 2005
Sold by
Saxon Debra and Saxon Michael
Bought by
Saxon Debra and Edmunds Terri
Current Estimated Value
Purchase Details
Closed on
Aug 19, 2005
Sold by
Dinsmore Marvin E and Dinsmore Joan L
Bought by
Saxon Debra and Edmunds Terri
Purchase Details
Closed on
Jul 11, 2002
Sold by
Lindemann Patrick M
Bought by
Dinsmore Marvin E and Dinsmore Joan L
Purchase Details
Closed on
Aug 2, 1999
Sold by
Bucher Donald E
Bought by
Lindemann Patrick M and Lindemann Birgit H
Home Financials for this Owner
Home Financials are based on the most recent Mortgage that was taken out on this home.
Original Mortgage
$12,325
Interest Rate
7.69%
Mortgage Type
New Conventional
Purchase Details
Closed on
Nov 23, 1994
Sold by
Cendel Group Ltd
Bought by
Bucher Donald E and Bucher Peggy
Purchase Details
Closed on
Feb 26, 1993
Bought by
Cendel Group Ltd
Purchase Details
Closed on
Jun 26, 1992
Bought by
Cendel Group Ltd
Create a Home Valuation Report for This Property
The Home Valuation Report is an in-depth analysis detailing your home's value as well as a comparison with similar homes in the area
Home Values in the Area
Average Home Value in this Area
Purchase History
| Date | Buyer | Sale Price | Title Company |
|---|---|---|---|
| Saxon Debra | -- | -- | |
| Saxon Debra | -- | -- | |
| Dinsmore Marvin E | $135,000 | -- | |
| Lindemann Patrick M | $122,000 | -- | |
| Bucher Donald E | $105,900 | -- | |
| Cendel Group Ltd | -- | -- | |
| Cendel Group Ltd | $43,800 | -- |
Source: Public Records
Mortgage History
| Date | Status | Borrower | Loan Amount |
|---|---|---|---|
| Previous Owner | Lindemann Patrick M | $12,325 |
Source: Public Records
Tax History
| Year | Tax Paid | Tax Assessment Tax Assessment Total Assessment is a certain percentage of the fair market value that is determined by local assessors to be the total taxable value of land and additions on the property. | Land | Improvement |
|---|---|---|---|---|
| 2024 | $3,204 | $75,730 | $15,630 | $60,100 |
| 2023 | $3,216 | $75,730 | $15,630 | $60,100 |
| 2022 | $2,949 | $55,280 | $11,410 | $43,870 |
| 2021 | $3,040 | $55,280 | $11,410 | $43,870 |
| 2020 | $2,886 | $55,280 | $11,410 | $43,870 |
| 2019 | $2,632 | $48,330 | $10,340 | $37,990 |
| 2018 | $2,639 | $48,330 | $10,340 | $37,990 |
| 2017 | $2,662 | $48,330 | $10,340 | $37,990 |
| 2016 | $2,748 | $46,520 | $10,340 | $36,180 |
| 2015 | $2,699 | $46,520 | $10,340 | $36,180 |
| 2014 | $2,701 | $46,520 | $10,340 | $36,180 |
| 2013 | $2,694 | $45,900 | $9,760 | $36,140 |
Source: Public Records
Map
Nearby Homes
- 2185 Ryan Ct
- 835 Marilyn Dr
- 869 Meadow Ln
- 2360 Star Dr
- 2447 Wetherington Ln Unit 131
- 2447 Wetherington Ln Unit 130
- 2447 Wetherington Ln
- 972 Carriage Ln
- 2457 Barrington Way Unit 327
- 2457 Barrington Way Unit 325
- 2520 Barrington Way
- 2452 Barrington Way Unit 424
- 2552 Monterey St
- 1942 Fisher Dr
- 1704 Carlin Trail
- 1627 Carlin Trail
- 1643 Carlin Trail
- 211 Oakley Rd
- 1087 Jesse Owens Dr
- 2011 Burbank Rd
- 2092 Melanie Dr
- 2177 Normandy Dr
- 2099 Melanie Dr
- 925 Brooke Way
- 2140 Melanie Dr
- 951 Brooke Way
- 2161 Normandy Dr
- 2119 Melanie Dr
- 877 Brooke Way
- 971 Brooke Way
- 2172 Normandy Dr
- 2139 Ryan Ct
- 2164 Melanie Dr
- 2145 Normandy Dr
- 2135 Melanie Dr
- 865 Brooke Way
- 2147 Melanie Dr
- 991 Brooke Way
- 930 Brooke Way
- 910 Brooke Way
Your Personal Tour Guide
Ask me questions while you tour the home.