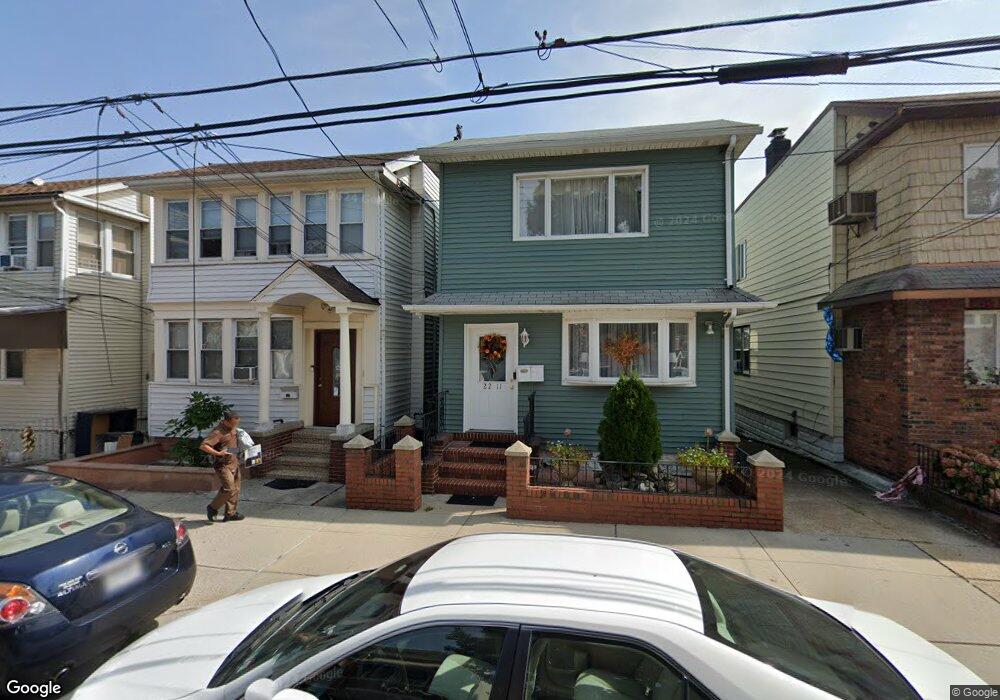
22-03 128th St Flushing, NY 11356
College Point NeighborhoodEstimated Value: $895,000 - $1,235,000
4
Beds
2
Baths
1,748
Sq Ft
$590/Sq Ft
Est. Value
About This Home
This home is located at 22-03 128th St, Flushing, NY 11356 and is currently estimated at $1,031,582, approximately $590 per square foot. 22-03 128th St is a home located in Queens County with nearby schools including P.S. 29, Jhs 185 Edward Bleeker, and Flushing High School.
Ownership History
Date
Name
Owned For
Owner Type
Purchase Details
Closed on
Aug 26, 2021
Sold by
Rosenfeld Jeanette
Bought by
Qiu Xia and Sun Chan Juan
Current Estimated Value
Home Financials for this Owner
Home Financials are based on the most recent Mortgage that was taken out on this home.
Original Mortgage
$600,000
Outstanding Balance
$542,724
Interest Rate
2.7%
Mortgage Type
Purchase Money Mortgage
Estimated Equity
$488,858
Purchase Details
Closed on
Feb 17, 2006
Sold by
Jeanette Rosenfeld As Executrix
Bought by
Rosenfeld Jeanette
Create a Home Valuation Report for This Property
The Home Valuation Report is an in-depth analysis detailing your home's value as well as a comparison with similar homes in the area
Home Values in the Area
Average Home Value in this Area
Purchase History
| Date | Buyer | Sale Price | Title Company |
|---|---|---|---|
| Qiu Xia | $858,000 | -- | |
| Qiu Xia | $858,000 | -- | |
| Qiu Xia | $858,000 | -- | |
| Rosenfeld Jeanette | -- | -- | |
| Rosenfeld Jeanette | -- | -- |
Source: Public Records
Mortgage History
| Date | Status | Borrower | Loan Amount |
|---|---|---|---|
| Open | Qiu Xia | $600,000 | |
| Closed | Qiu Xia | $600,000 |
Source: Public Records
Tax History
| Year | Tax Paid | Tax Assessment Tax Assessment Total Assessment is a certain percentage of the fair market value that is determined by local assessors to be the total taxable value of land and additions on the property. | Land | Improvement |
|---|---|---|---|---|
| 2025 | $7,772 | $39,701 | $8,097 | $31,604 |
| 2024 | $7,772 | $38,695 | $7,755 | $30,940 |
| 2023 | $7,340 | $36,547 | $7,485 | $29,062 |
| 2022 | $6,952 | $60,300 | $11,760 | $48,540 |
| 2021 | $6,967 | $53,760 | $11,760 | $42,000 |
| 2020 | $6,393 | $49,200 | $11,760 | $37,440 |
| 2019 | $6,143 | $49,200 | $11,760 | $37,440 |
| 2018 | $5,621 | $30,456 | $9,031 | $21,425 |
| 2017 | $5,563 | $29,020 | $9,115 | $19,905 |
| 2016 | $1,961 | $29,020 | $9,115 | $19,905 |
| 2015 | $1,122 | $27,570 | $12,241 | $15,329 |
| 2014 | $1,122 | $26,872 | $12,103 | $14,769 |
Source: Public Records
Map
Nearby Homes
- 20-36 126th St
- 23-09 128th St
- 2220 126th St
- 22-24 126th St
- 18-14 129th St
- 23-24 128th St
- 2008 125th St
- 18-43 124th St
- 2232 124th St
- 2105 123rd St
- 23-13 123rd St
- 18-11 123rd St Unit 4F
- 1839 College Point Blvd
- 2521 127th St
- 15-24 124th St
- 2045 121st St
- 23-06 College Point Blvd
- 238 College Point Blvd
- 125-19 14th Ave
- 13-25 126th St
Your Personal Tour Guide
Ask me questions while you tour the home.